QUESTION IMAGE
Question
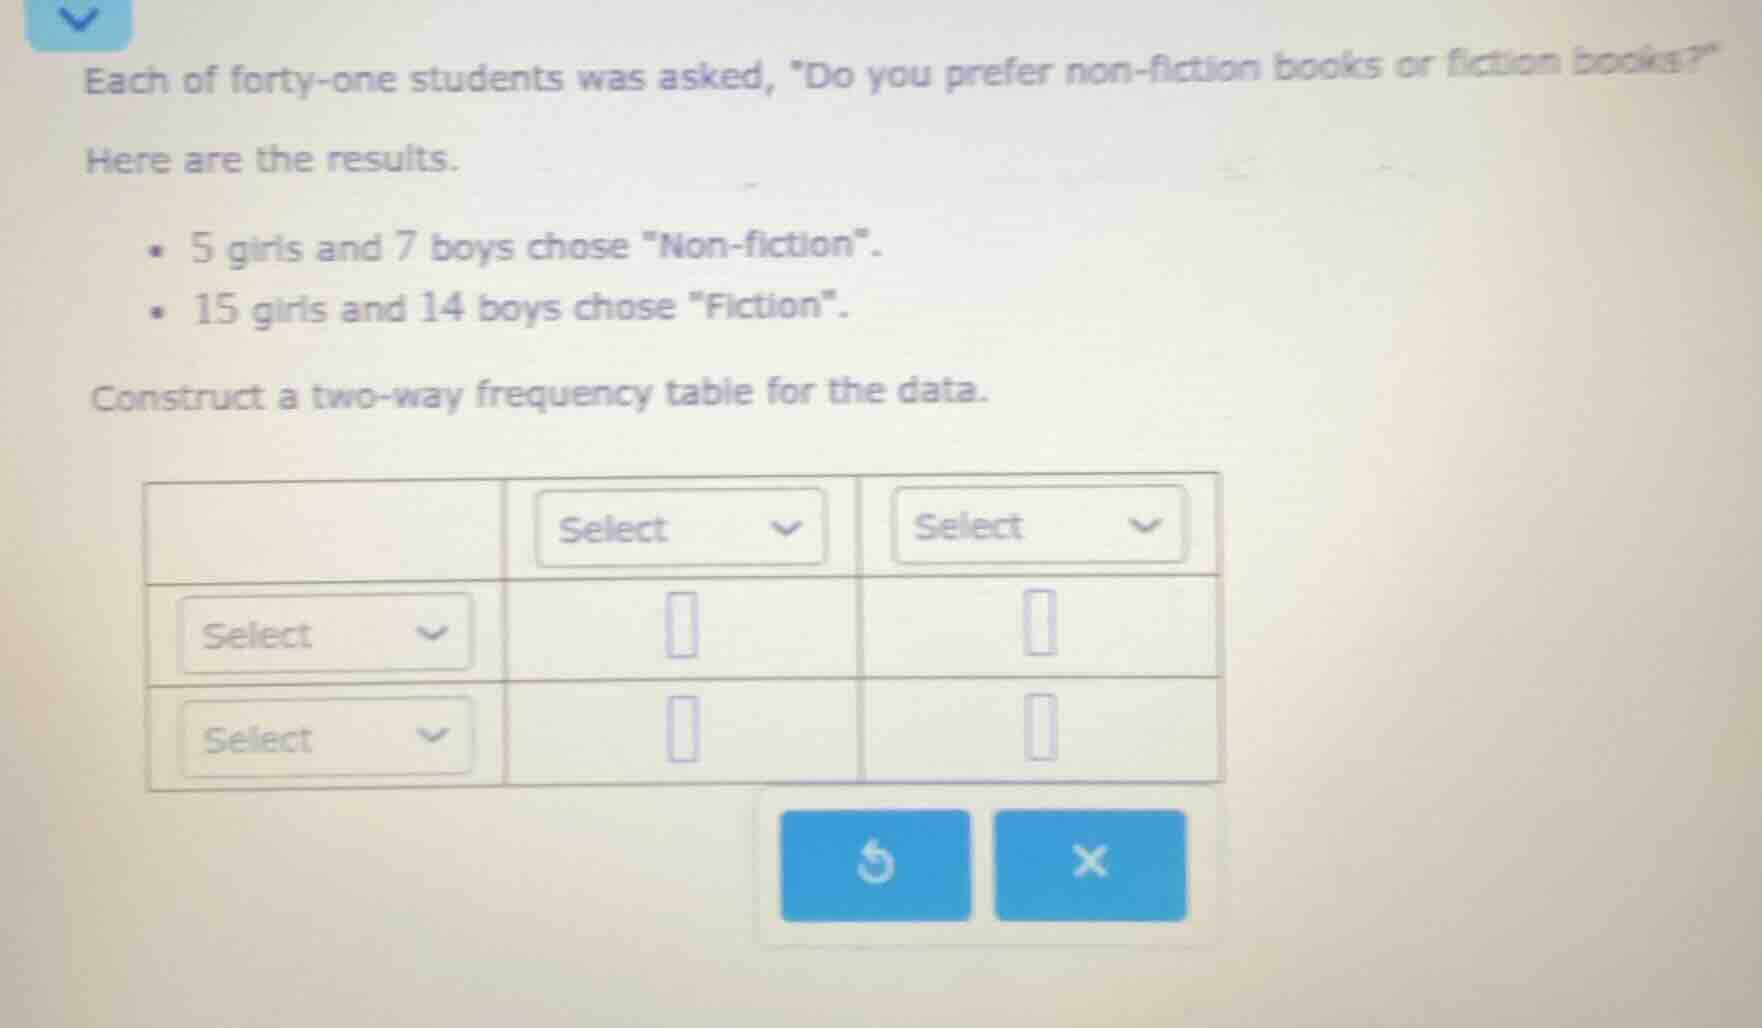
each of forty - one students was asked, \do you prefer non - fiction books or fiction books?\ here are the results. • 5 girls and 7 boys chose
on - fiction\. • 15 girls and 14 boys chose \fiction\. construct a two - way frequency table for the data.
Step1: Define table categories
Rows: Gender (Girls, Boys); Columns: Preference (Non-fiction, Fiction)
Step2: Fill non-fiction values
Girls: 5, Boys: 7
Step3: Fill fiction values
Girls: 15, Boys: 14

Snap & solve any problem in the app
Get step-by-step solutions on Sovi AI
Photo-based solutions with guided steps
Explore more problems and detailed explanations
| Non-fiction | Fiction | |
|---|---|---|
| Boys | 7 | 14 |