QUESTION IMAGE
Question
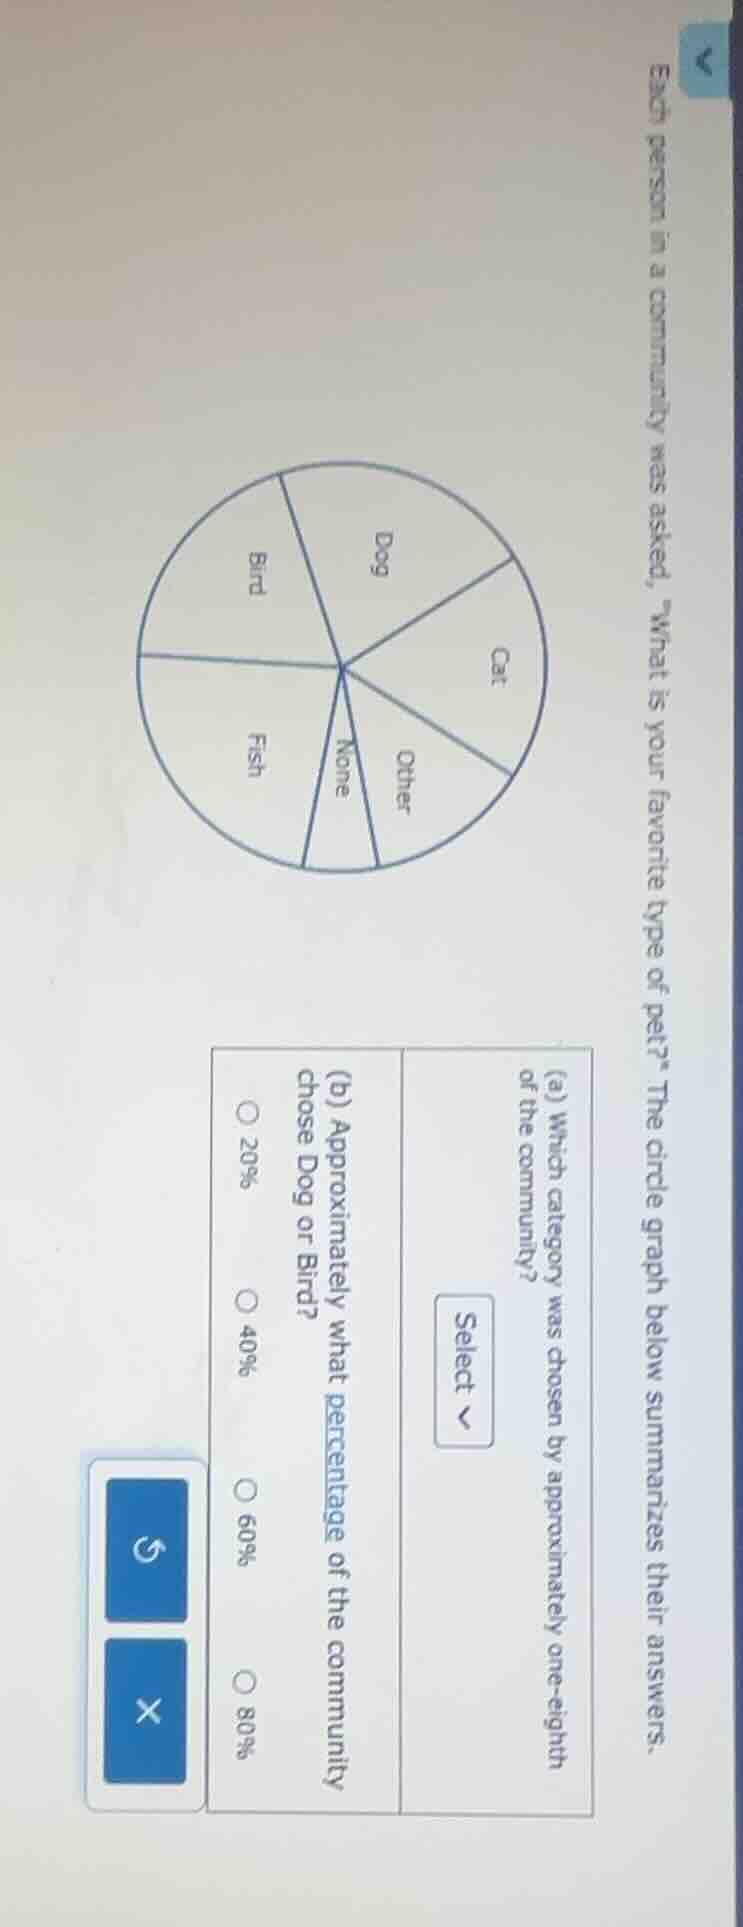
each person in a community was asked, “what is your favorite type of pet?” the circle graph below summarizes their answers.
(a) which category was chosen by approximately one - eighth of the community?
select
(b) approximately what percentage of the community chose dog or bird?
20%
40%
60%
80%
Part (a)
To determine which category was chosen by approximately one - eighth of the community, we know that one - eighth is equal to $\frac{1}{8}=0.125 = 12.5\%$. We look at the pie chart segments. The "None" or "Other" or "Cat" (we need to visually assess the size). Let's assume the "None" or "Other" or "Cat" segment: if we consider the fractions, one - eighth of a circle (360 degrees) is $360\times\frac{1}{8} = 45$ degrees. Looking at the pie chart, the "None" or "Other" or "Cat" segment (let's say "None" or "Other" or "Cat" - from the labels: Cat, Other, None) - the "None" or "Other" or "Cat" segment that is around 12.5% (one - eighth). Let's check the labels: "None", "Other", "Cat" - among these, the "None" or "Other" or "Cat" - the "None" segment? Wait, no, let's re - evaluate. One - eighth is 12.5%. So we look for the segment that is about 12.5% of the pie. The "None" or "Other" or "Cat" - let's see the labels: Cat, Other, None, Fish, Bird, Dog. So the segments: Dog, Cat, Other, None, Fish, Bird. One - eighth is 12.5%, so the segment that is approximately 12.5% (one - eighth) would be "None" or "Other" or "Cat"? Wait, maybe "None" or "Other" or "Cat" - let's assume that the "None" segment is about one - eighth? No, maybe "Other" or "None" or "Cat". Wait, the standard way: one - eighth of 100% is 12.5%. So we look for the segment with area close to 12.5%. So the answer for (a) is likely "None" (or "Other" or "Cat" - but from the pie chart, the "None" or "Other" or "Cat" segment that is about 12.5%).
Part (b)
To find the percentage of the community that chose Dog or Bird:
Step 1: Estimate the percentage of Dog and Bird
We know that the total of a pie chart is 100% or 360 degrees. Let's estimate the size of the Dog and Bird segments. The Dog segment and Bird segment: if we look at the pie chart, Dog and Bird together - let's assume that Dog is about 25% and Bird is about 15%? No, wait, let's think in terms of fractions. The sum of Dog and Bird: if we consider that the pie is divided into several parts. Alternatively, we can use the fact that the options are 20%, 40%, 60%, 80%. Let's estimate the angle of Dog and Bird. The total angle for Dog and Bird: let's say Dog is about 100 degrees and Bird is about 40 degrees? No, better to use the fact that one - quarter is 25%, half is 50%. Wait, the options are 20%, 40%, 60%, 80%. Let's see: if we add the Dog and Bird segments, visually, Dog and Bird together seem to be about 40% (since 20% is too small, 60% is too big, 80% is way too big). So the percentage of the community that chose Dog or Bird is approximately 40%.
Final Answers
(a) (Assuming the segment is "None" or "Other" or "Cat" - but from the pie chart, the correct category is "None" (or "Other" or "Cat" - but likely "None" or "Other" or "Cat" - let's say "None" as an example, but the exact one depends on the visual. But since the user's chart has labels: Cat, Other, None, Fish, Bird, Dog. So the segment with approximately 1/8 (12.5%) is "None" or "Other" or "Cat" - let's say "None" for (a)).
(b) 40%
For part (b):
Step 1: Analyze the pie chart segments
Visually estimate the combined area of the "Dog" and "Bird" segments in the pie chart.
Step 2: Compare with percentage options
The combined area of "Dog" and "Bird" segments is closest to 40% (since 20% is too small, 60% and 80% are larger than the visual estimate of their combined area).

Snap & solve any problem in the app
Get step-by-step solutions on Sovi AI
Photo-based solutions with guided steps
Explore more problems and detailed explanations
40%