QUESTION IMAGE
Question
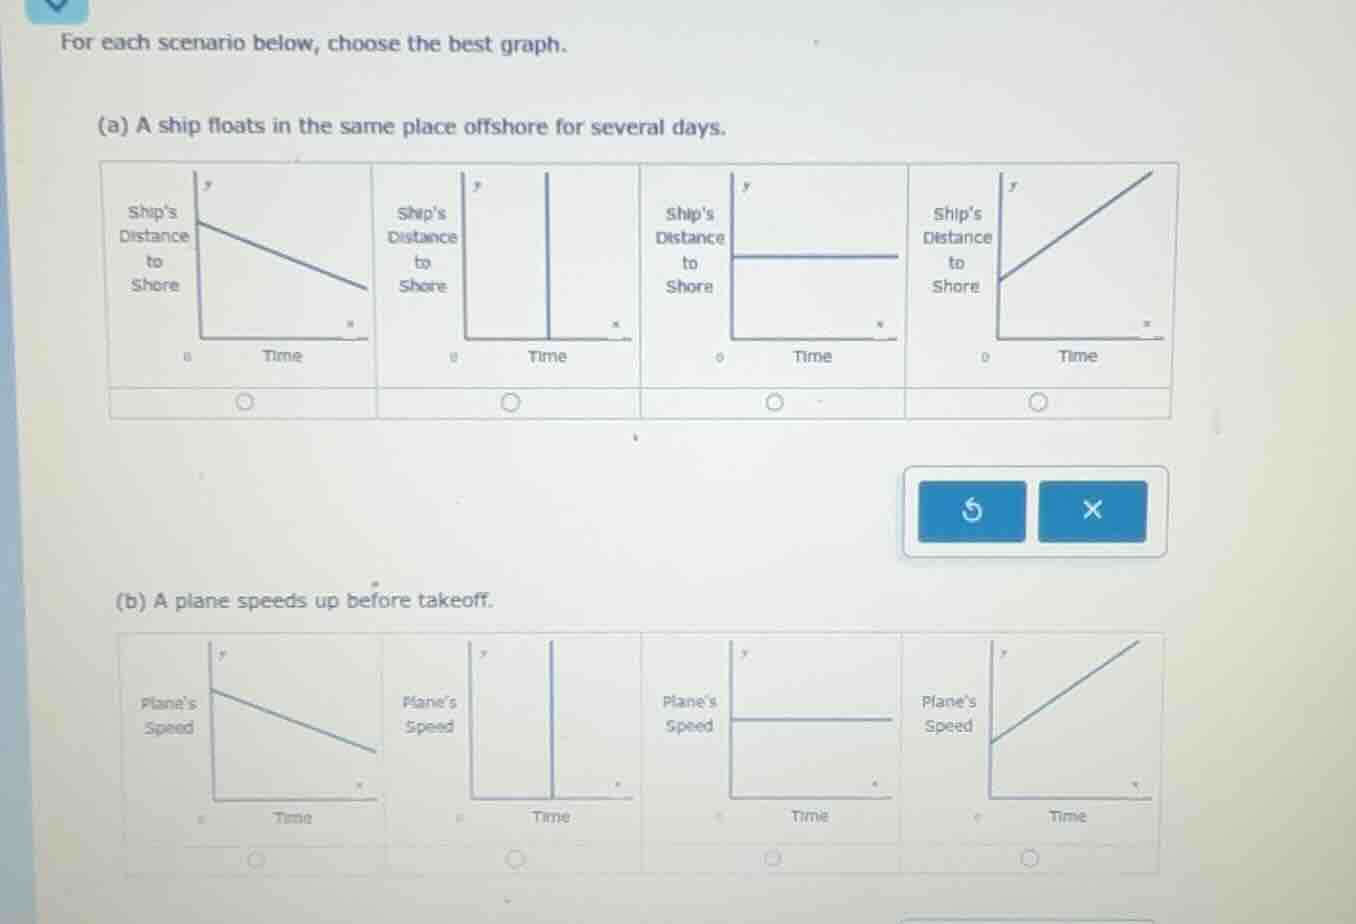
for each scenario below, choose the best graph.
(a) a ship floats in the same place offshore for several days.
four graphs with ships distance to shore on y - axis and time on x - axis, each with a radio button
(b) a plane speeds up before takeoff.
four graphs with planes speed on y - axis and time on x - axis, each with a radio button
Step1: Analyze scenario (a)
The ship's distance to shore stays constant over time, so we need a horizontal line graph (distance does not change as time increases).
Step2: Analyze scenario (b)
The plane speeds up before takeoff, so its speed increases linearly over time, which corresponds to an upward-sloping line graph (speed rises as time increases).

Snap & solve any problem in the app
Get step-by-step solutions on Sovi AI
Photo-based solutions with guided steps
Explore more problems and detailed explanations
(a) Third graph (horizontal line: Ship's Distance to Shore remains constant as Time increases)
(b) Fourth graph (upward-sloping line: Plane's Speed increases as Time increases)