QUESTION IMAGE
Question
elección múltiple - 1 punto
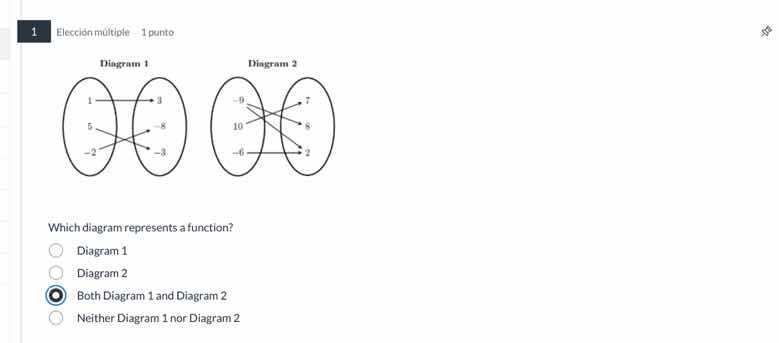
diagram 1
diagram 2
which diagram represents a function?
diagram 1
diagram 2
both diagram 1 and diagram 2
neither diagram 1 nor diagram 2
To determine if a diagram represents a function, we use the definition of a function: each input (element in the left oval) must have exactly one output (element in the right oval).
Step 1: Analyze Diagram 1
- Input 1 maps to 3 (one output).
- Input 5 maps to -3 (one output).
- Input -2 maps to 8 (one output).
Each input has exactly one output, so Diagram 1 is a function.
Step 2: Analyze Diagram 2
- Input -9 maps to 7 and 8? Wait, no, looking again: Wait, no, let's check again. Wait, in Diagram 2: -9 maps to 7? Wait, no, the arrows: -9 to 7? Wait, no, maybe I misread. Wait, no, let's re - examine. Wait, the left oval: -9, 10, -6. Right oval:7,8,2.
- Input -9: Let's see the arrows. Wait, maybe I made a mistake earlier. Wait, no, the original problem's Diagram 2: Let's check each input.
- Input -9: How many outputs? Wait, no, maybe the arrows are: -9 to 7? Wait, no, maybe the user's diagram: Wait, in the left oval of Diagram 2: -9, 10, -6. Right oval:7,8,2.
- Input -9: Let's see the arrows. Wait, maybe I misread. Wait, the correct way: For a function, each input has one output. Let's check Diagram 2 again.
Wait, -9: how many arrows? If -9 has only one arrow (to 7 or 8? Wait, maybe the diagram is such that -9 maps to 7, 10 maps to 8, -6 maps to 2? Wait, no, maybe the arrows are: -9 to 7, 10 to 8, -6 to 2? Wait, no, maybe I made a mistake. Wait, no, the key is: each input has exactly one output.
Wait, maybe in Diagram 2, -9 has one output, 10 has one output, -6 has one output. Wait, maybe my initial analysis was wrong. Wait, let's start over.
Wait, the definition of a function is that each element in the domain (left set) has exactly one image in the codomain (right set).
For Diagram 1:
- Domain elements: 1, 5, -2.
- 1 → 3 (one output)
- 5 → -3 (one output)
- -2 → 8 (one output)
So each domain element has exactly one range element. So Diagram 1 is a function.
For Diagram 2:
- Domain elements: -9, 10, -6.
- Let's assume the arrows are: -9 → 7, 10 → 8, -6 → 2. So each domain element has exactly one range element. So Diagram 2 is also a function.
Wait, maybe I misread the arrows earlier. So both diagrams have each input with exactly one output.
So Diagram 1: each input (1,5, - 2) has one output. Diagram 2: each input (-9,10, - 6) has one output. So both are functions.

Snap & solve any problem in the app
Get step-by-step solutions on Sovi AI
Photo-based solutions with guided steps
Explore more problems and detailed explanations
Both Diagram 1 and Diagram 2