QUESTION IMAGE
Question
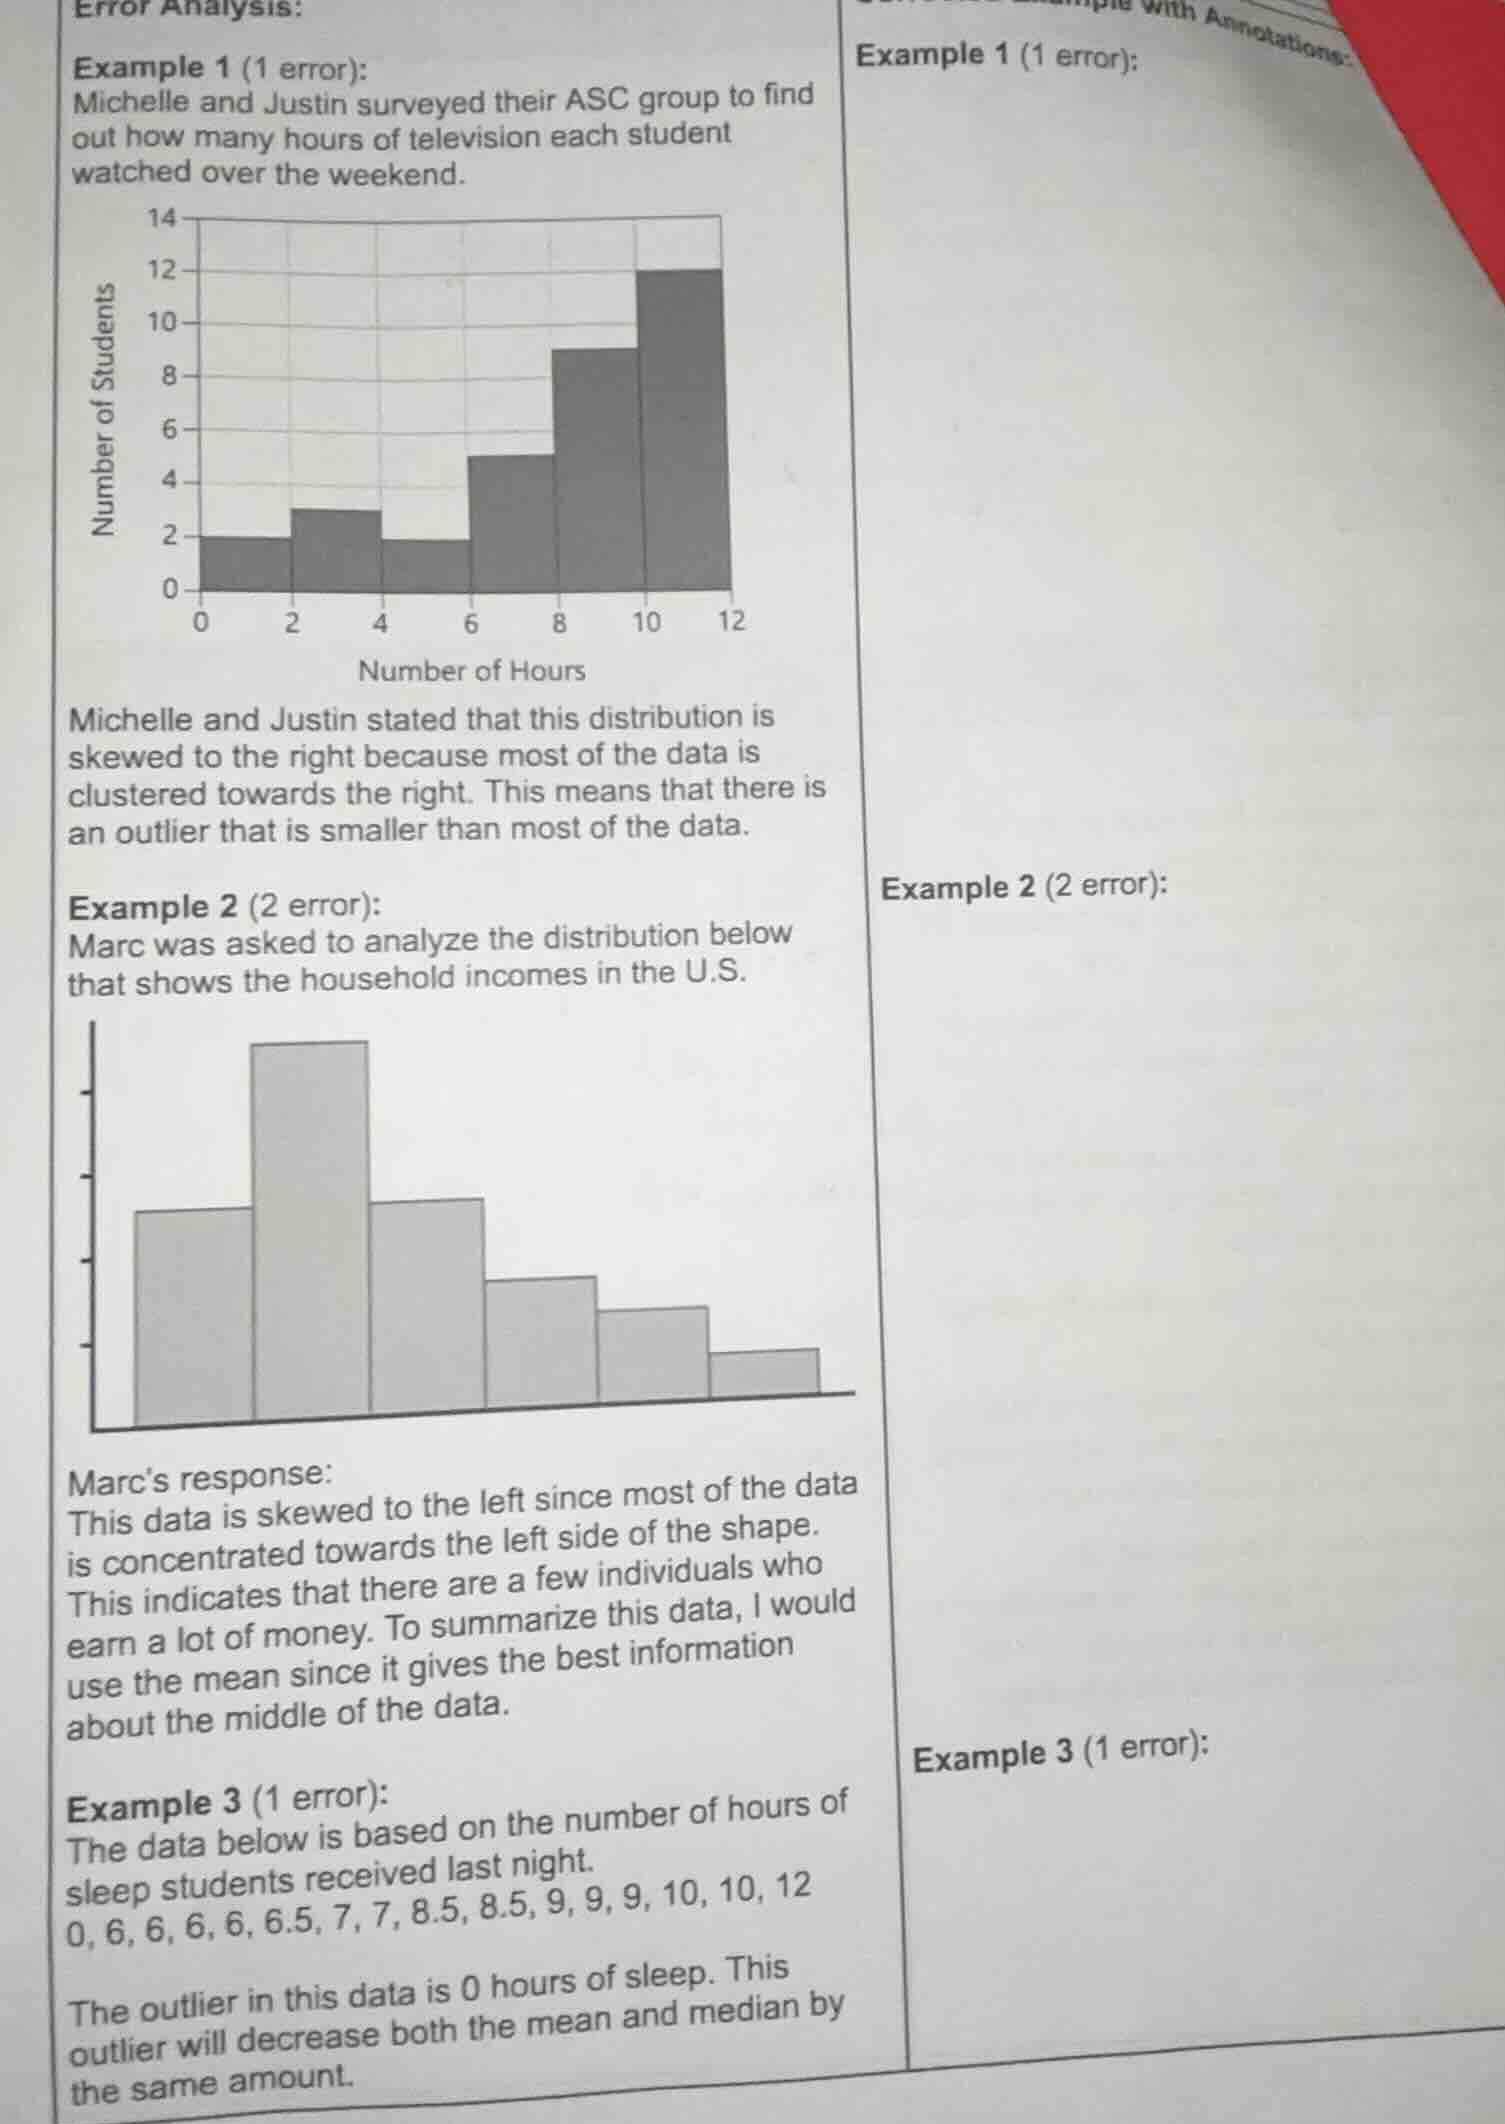
error analysis:
example 1 (1 error):
michelle and justin surveyed their asc group to find out how many hours of television each student watched over the weekend.
bar graph with number of students on y - axis (0 - 14) and number of hours on x - axis (0, 2, 4, 6, 8, 10, 12). bars: 0 - 2 hours: 2 students, 2 - 4 hours: 3 students, 4 - 6 hours: 2 students, 6 - 8 hours: 5 students, 8 - 10 hours: 9 students, 10 - 12 hours: 12 students
michelle and justin stated that this distribution is skewed to the right because most of the data is clustered towards the right. this means that there is an outlier that is smaller than most of the data.
example 2 (2 error):
marc was asked to analyze the distribution below that shows the household incomes in the u.s.
bar graph with y - axis (not labeled) and x - axis (household income ranges). bars: first bar (low income): moderate height, second bar (middle - low income): tallest, third bar (middle income): moderate height, fourth bar (middle - high income): shorter, fifth bar (high income): shorter, sixth bar (very high income): shortest
marcs response:
this data is skewed to the left since most of the data is concentrated towards the left side of the shape. this indicates that there are a few individuals who earn a lot of money. to summarize this data, i would use the mean since it gives the best information about the middle of the data.
example 3 (1 error):
the data below is based on the number of hours of sleep students received last night.
0, 6, 6, 6, 6, 6.5, 7, 7, 8.5, 8.5, 9, 9, 9, 10, 10, 12
the outlier in this data is 0 hours of sleep. this outlier will decrease both the mean and median by the same amount.
To address the error analysis for these examples, we'll examine each one:
Example 1
- Error: Misunderstanding skewness. A right - skewed (positively skewed) distribution has most data clustered on the left, with a tail on the right. Michelle and Justin said most data is on the right, which is incorrect. Also, the description of the outlier is wrong. In a right - skewed distribution, outliers are on the right (larger than most data), not smaller.
- Correct Explanation: A right - skewed distribution has the majority of data values on the left side of the distribution, and the tail extends to the right (towards larger values). If most data is on the right, the distribution is left - skewed (negatively skewed). And in a right - skewed distribution, outliers (if any) would be on the right (larger than the main cluster of data).
Example 2
- Error 1: Misidentifying skewness. The data (household incomes) has a tail on the right (since there are a few high - income earners), so it is right - skewed, not left - skewed.
- Error 2: Using the mean for a skewed distribution. For a skewed distribution, the median is a better measure of central tendency than the mean because the mean is affected by outliers (the few high - income earners in this case).
- Correct Explanation:
- Skewness: Since there are a few individuals with very high incomes (the tail on the right), the distribution is right - skewed (positively skewed), not left - skewed.
- Measure of central tendency: For a skewed distribution, the median should be used to summarize the "middle" of the data because the mean is pulled in the direction of the skew (by the high - income outliers here).
Example 3
- Error: The outlier (0 hours of sleep) affects the mean and median differently. The mean is affected more by outliers because it is calculated as the sum of all values divided by the number of values. The median is the middle value (or average of two middle values) and is less affected by extreme values.
- Correct Explanation: An outlier like 0 will decrease the mean because it is a very low value that pulls the sum down. The median, however, is determined by the order of the data. The outlier (0) will only change the median if it changes the position of the middle value(s), and this change is not the same as the change in the mean. In general, the mean is more sensitive to outliers than the median.

Snap & solve any problem in the app
Get step-by-step solutions on Sovi AI
Photo-based solutions with guided steps
Explore more problems and detailed explanations
To address the error analysis for these examples, we'll examine each one:
Example 1
- Error: Misunderstanding skewness. A right - skewed (positively skewed) distribution has most data clustered on the left, with a tail on the right. Michelle and Justin said most data is on the right, which is incorrect. Also, the description of the outlier is wrong. In a right - skewed distribution, outliers are on the right (larger than most data), not smaller.
- Correct Explanation: A right - skewed distribution has the majority of data values on the left side of the distribution, and the tail extends to the right (towards larger values). If most data is on the right, the distribution is left - skewed (negatively skewed). And in a right - skewed distribution, outliers (if any) would be on the right (larger than the main cluster of data).
Example 2
- Error 1: Misidentifying skewness. The data (household incomes) has a tail on the right (since there are a few high - income earners), so it is right - skewed, not left - skewed.
- Error 2: Using the mean for a skewed distribution. For a skewed distribution, the median is a better measure of central tendency than the mean because the mean is affected by outliers (the few high - income earners in this case).
- Correct Explanation:
- Skewness: Since there are a few individuals with very high incomes (the tail on the right), the distribution is right - skewed (positively skewed), not left - skewed.
- Measure of central tendency: For a skewed distribution, the median should be used to summarize the "middle" of the data because the mean is pulled in the direction of the skew (by the high - income outliers here).
Example 3
- Error: The outlier (0 hours of sleep) affects the mean and median differently. The mean is affected more by outliers because it is calculated as the sum of all values divided by the number of values. The median is the middle value (or average of two middle values) and is less affected by extreme values.
- Correct Explanation: An outlier like 0 will decrease the mean because it is a very low value that pulls the sum down. The median, however, is determined by the order of the data. The outlier (0) will only change the median if it changes the position of the middle value(s), and this change is not the same as the change in the mean. In general, the mean is more sensitive to outliers than the median.