QUESTION IMAGE
Question
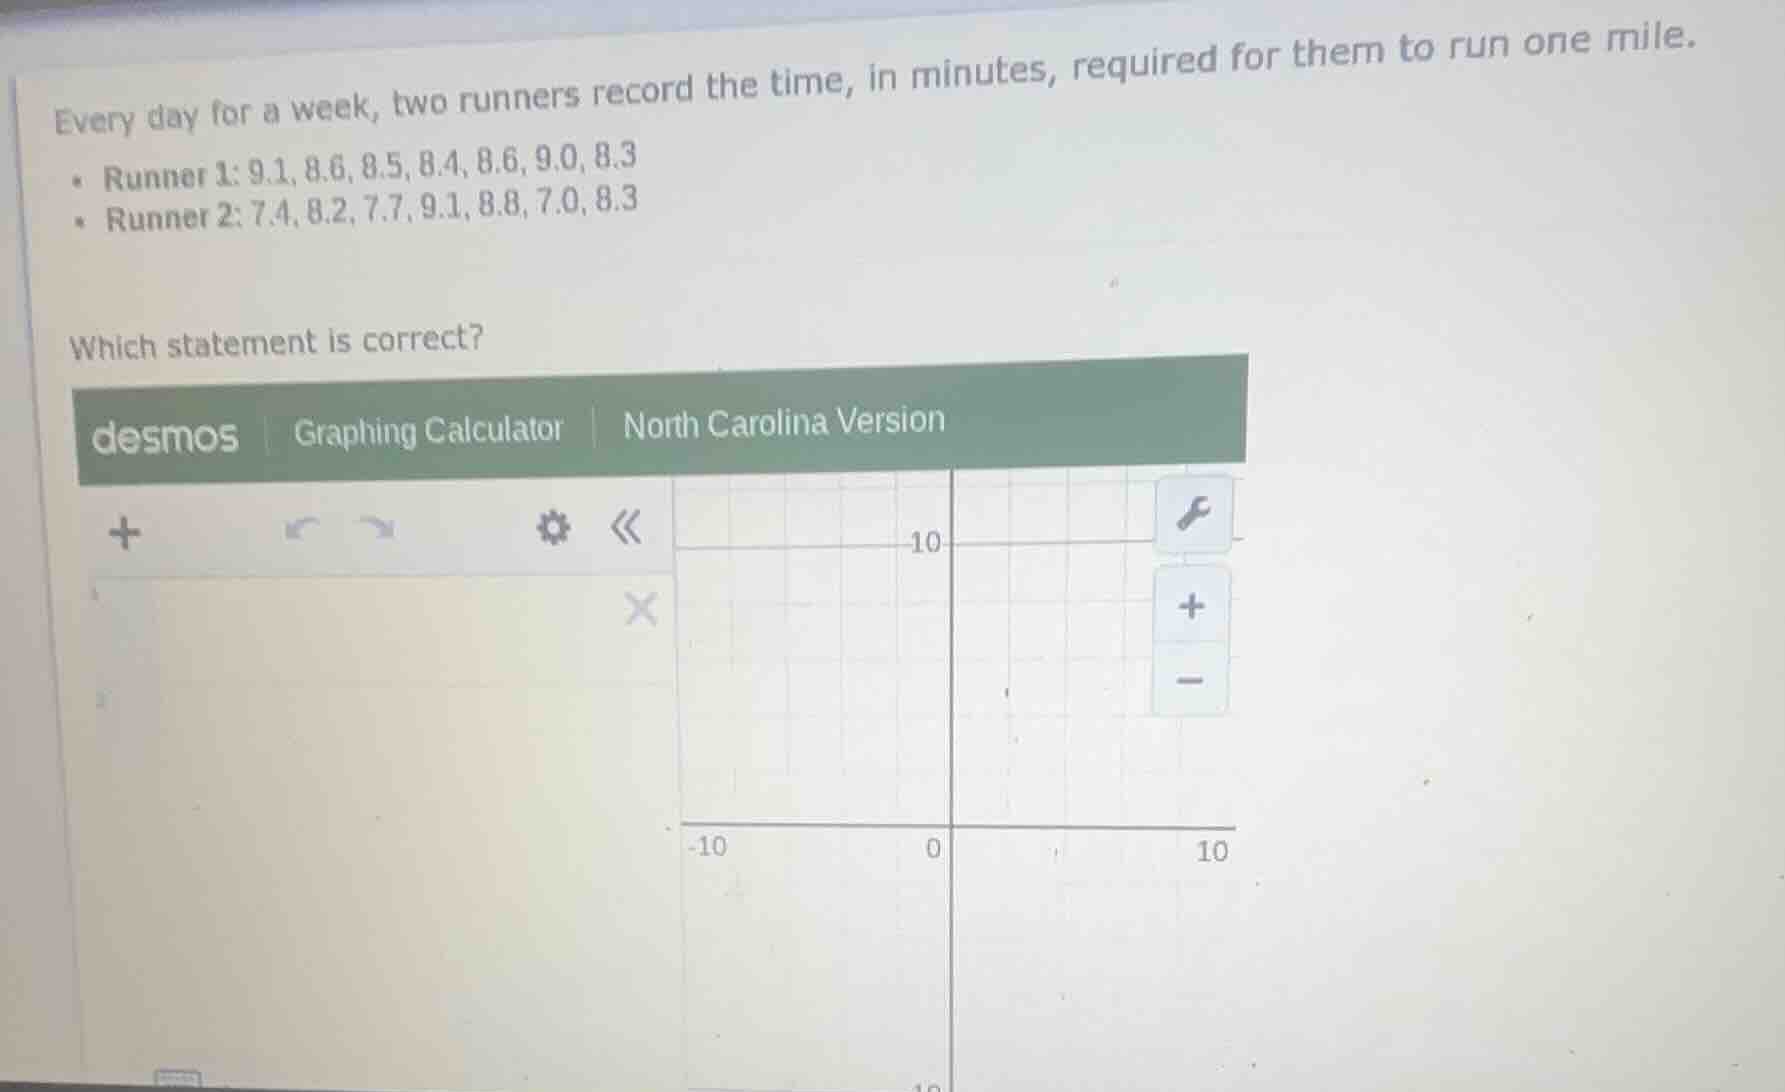
every day for a week, two runners record the time, in minutes, required for them to run one mile.
- runner 1: 9.1, 8.6, 8.5, 8.4, 8.6, 9.0, 8.3
- runner 2: 7.4, 8.2, 7.7, 9.1, 8.8, 7.0, 8.3
which statement is correct?
desmos graphing calculator north carolina version
To solve this, we typically analyze measures like mean, median, or standard deviation (for variability) of the two runners' times. Let's find the mean (average) and assess variability (e.g., range, standard deviation) for both.
Step 1: Calculate Mean for Runner 1
Sum of Runner 1’s times: \( 9.1 + 8.6 + 8.5 + 8.4 + 8.6 + 9.0 + 8.3 \)
First, add the numbers:
\( 9.1 + 8.6 = 17.7 \); \( 17.7 + 8.5 = 26.2 \); \( 26.2 + 8.4 = 34.6 \); \( 34.6 + 8.6 = 43.2 \); \( 43.2 + 9.0 = 52.2 \); \( 52.2 + 8.3 = 60.5 \)
Mean = \( \frac{60.5}{7} \approx 8.64 \) minutes
Step 2: Calculate Mean for Runner 2
Sum of Runner 2’s times: \( 7.4 + 8.2 + 7.7 + 9.1 + 8.8 + 7.0 + 8.3 \)
Add the numbers:
\( 7.4 + 8.2 = 15.6 \); \( 15.6 + 7.7 = 23.3 \); \( 23.3 + 9.1 = 32.4 \); \( 32.4 + 8.8 = 41.2 \); \( 41.2 + 7.0 = 48.2 \); \( 48.2 + 8.3 = 56.5 \)
Mean = \( \frac{56.5}{7} \approx 8.07 \) minutes
Step 3: Analyze Variability (e.g., Range)
- Runner 1’s range: Max - Min = \( 9.1 - 8.3 = 0.8 \)
- Runner 2’s range: Max - Min = \( 9.1 - 7.0 = 2.1 \)
Step 4: Interpret Results
- Runner 2 has a lower mean (faster average time) but a larger range (more variability in times).
- Runner 1 has a higher mean (slower average) but a smaller range (more consistent times).
For example, if a statement claims “Runner 2 has a lower mean time but greater variability than Runner 1,” this would be correct (based on the calculations: mean ≈ 8.07 vs. 8.64; range 2.1 vs. 0.8).
(Note: Since the specific options aren’t provided, the key is to compute mean and variability. If options involve mean, median, or standard deviation, use these calculations to identify the correct one.)

Snap & solve any problem in the app
Get step-by-step solutions on Sovi AI
Photo-based solutions with guided steps
Explore more problems and detailed explanations
To solve this, we typically analyze measures like mean, median, or standard deviation (for variability) of the two runners' times. Let's find the mean (average) and assess variability (e.g., range, standard deviation) for both.
Step 1: Calculate Mean for Runner 1
Sum of Runner 1’s times: \( 9.1 + 8.6 + 8.5 + 8.4 + 8.6 + 9.0 + 8.3 \)
First, add the numbers:
\( 9.1 + 8.6 = 17.7 \); \( 17.7 + 8.5 = 26.2 \); \( 26.2 + 8.4 = 34.6 \); \( 34.6 + 8.6 = 43.2 \); \( 43.2 + 9.0 = 52.2 \); \( 52.2 + 8.3 = 60.5 \)
Mean = \( \frac{60.5}{7} \approx 8.64 \) minutes
Step 2: Calculate Mean for Runner 2
Sum of Runner 2’s times: \( 7.4 + 8.2 + 7.7 + 9.1 + 8.8 + 7.0 + 8.3 \)
Add the numbers:
\( 7.4 + 8.2 = 15.6 \); \( 15.6 + 7.7 = 23.3 \); \( 23.3 + 9.1 = 32.4 \); \( 32.4 + 8.8 = 41.2 \); \( 41.2 + 7.0 = 48.2 \); \( 48.2 + 8.3 = 56.5 \)
Mean = \( \frac{56.5}{7} \approx 8.07 \) minutes
Step 3: Analyze Variability (e.g., Range)
- Runner 1’s range: Max - Min = \( 9.1 - 8.3 = 0.8 \)
- Runner 2’s range: Max - Min = \( 9.1 - 7.0 = 2.1 \)
Step 4: Interpret Results
- Runner 2 has a lower mean (faster average time) but a larger range (more variability in times).
- Runner 1 has a higher mean (slower average) but a smaller range (more consistent times).
For example, if a statement claims “Runner 2 has a lower mean time but greater variability than Runner 1,” this would be correct (based on the calculations: mean ≈ 8.07 vs. 8.64; range 2.1 vs. 0.8).
(Note: Since the specific options aren’t provided, the key is to compute mean and variability. If options involve mean, median, or standard deviation, use these calculations to identify the correct one.)