QUESTION IMAGE
Question
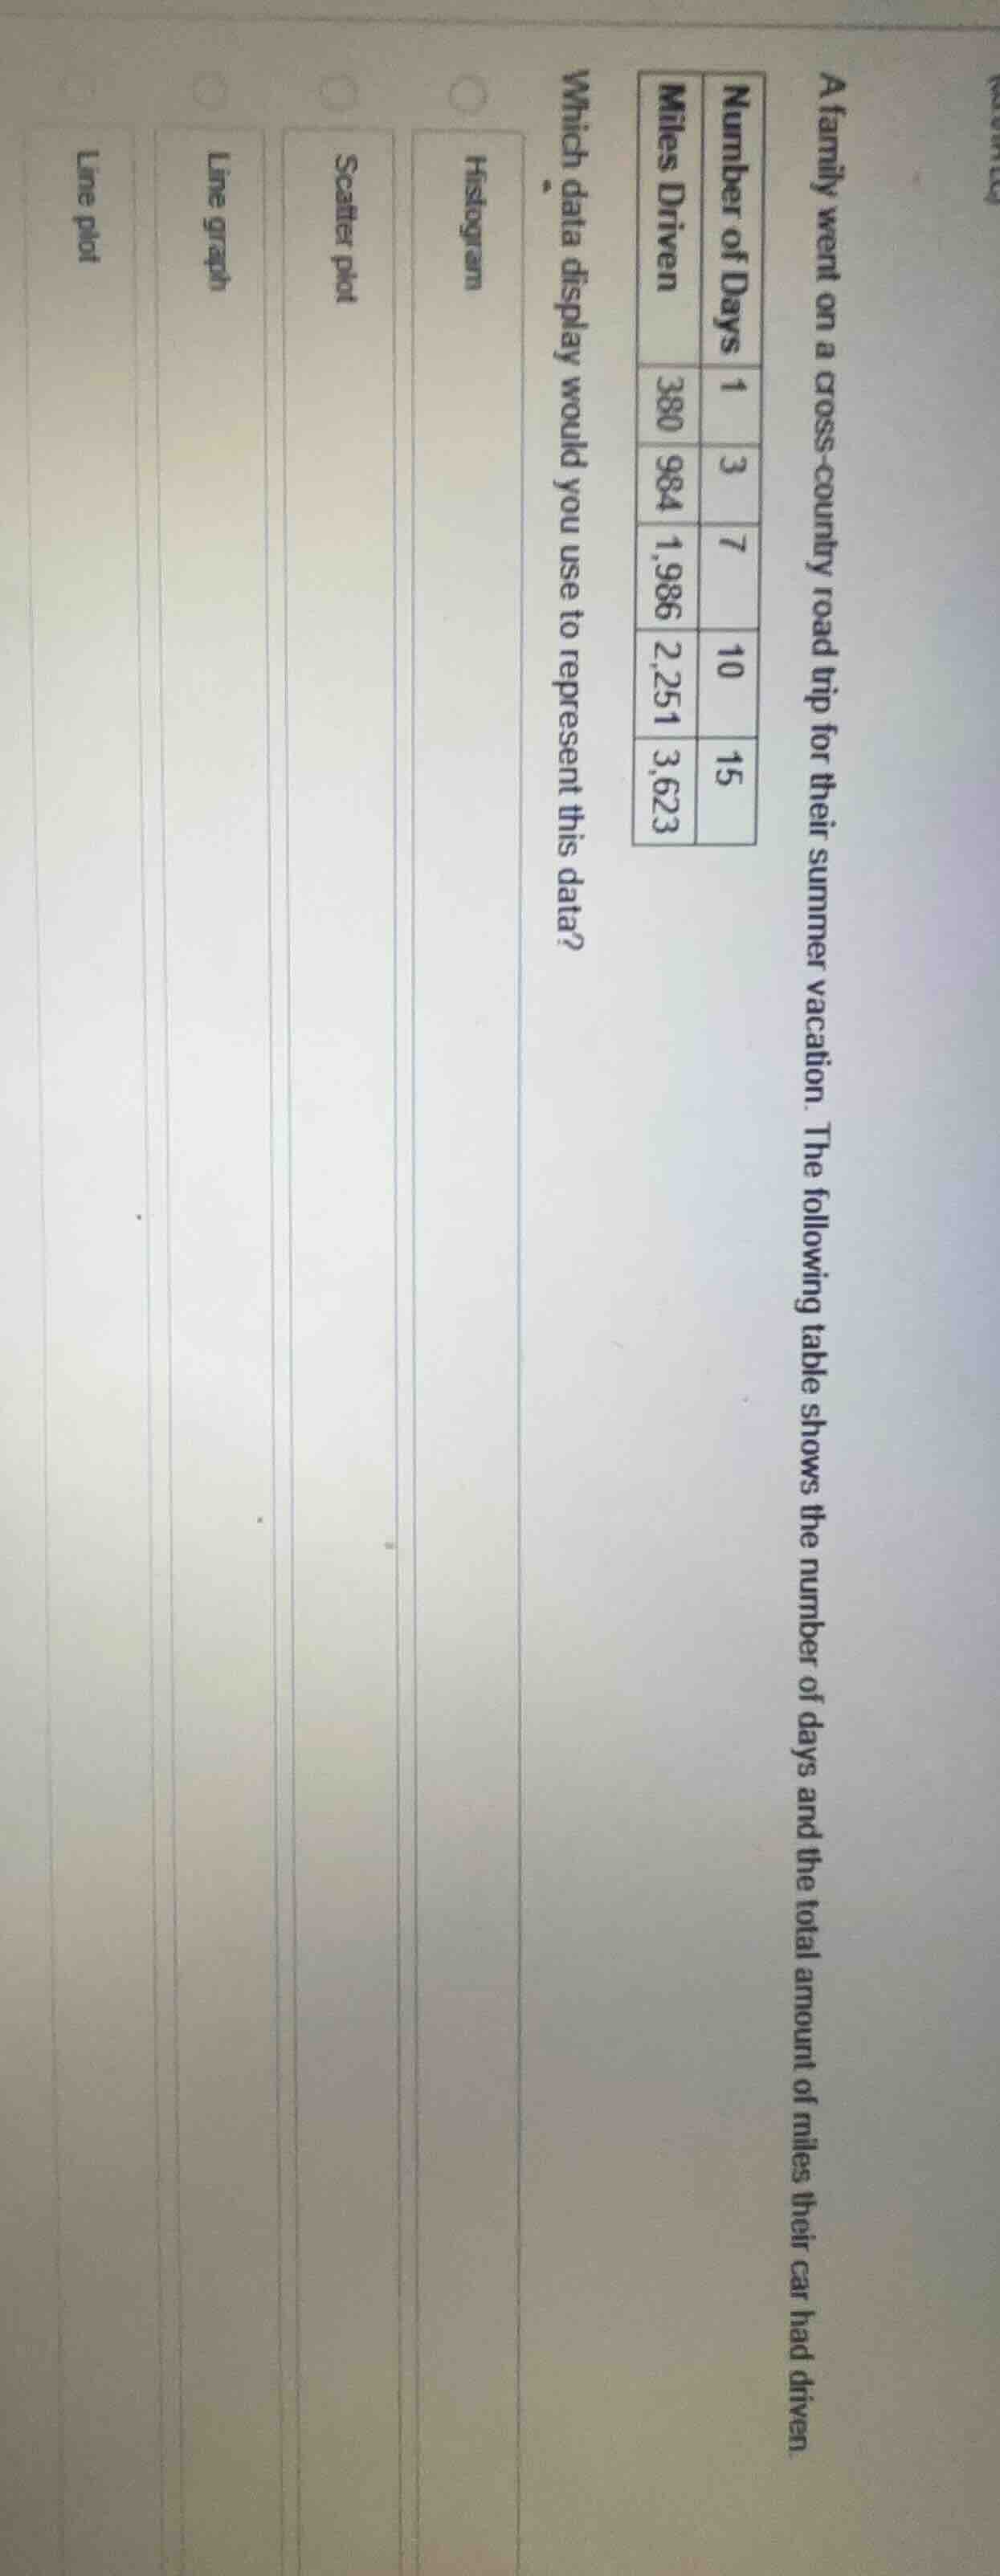
a family went on a cross - country road trip for their summer vacation. the following table shows the number of days and the total amount of miles their car had driven.
| number of days | 1 | 3 | 7 | 10 | 15 |
|---|
which data display would you use to represent this data?
- histogram
- scatter plot
- line graph
- line plot
Brief Explanations
The data pairs two numerical variables: number of days and total miles driven. A scatter plot is designed to show the relationship between two quantitative variables, while the other options are unsuitable: histograms show frequency distributions, line graphs track trends over continuous variables, and line plots show frequencies of single values.

Snap & solve any problem in the app
Get step-by-step solutions on Sovi AI
Photo-based solutions with guided steps
Explore more problems and detailed explanations
Scatter plot