QUESTION IMAGE
Question
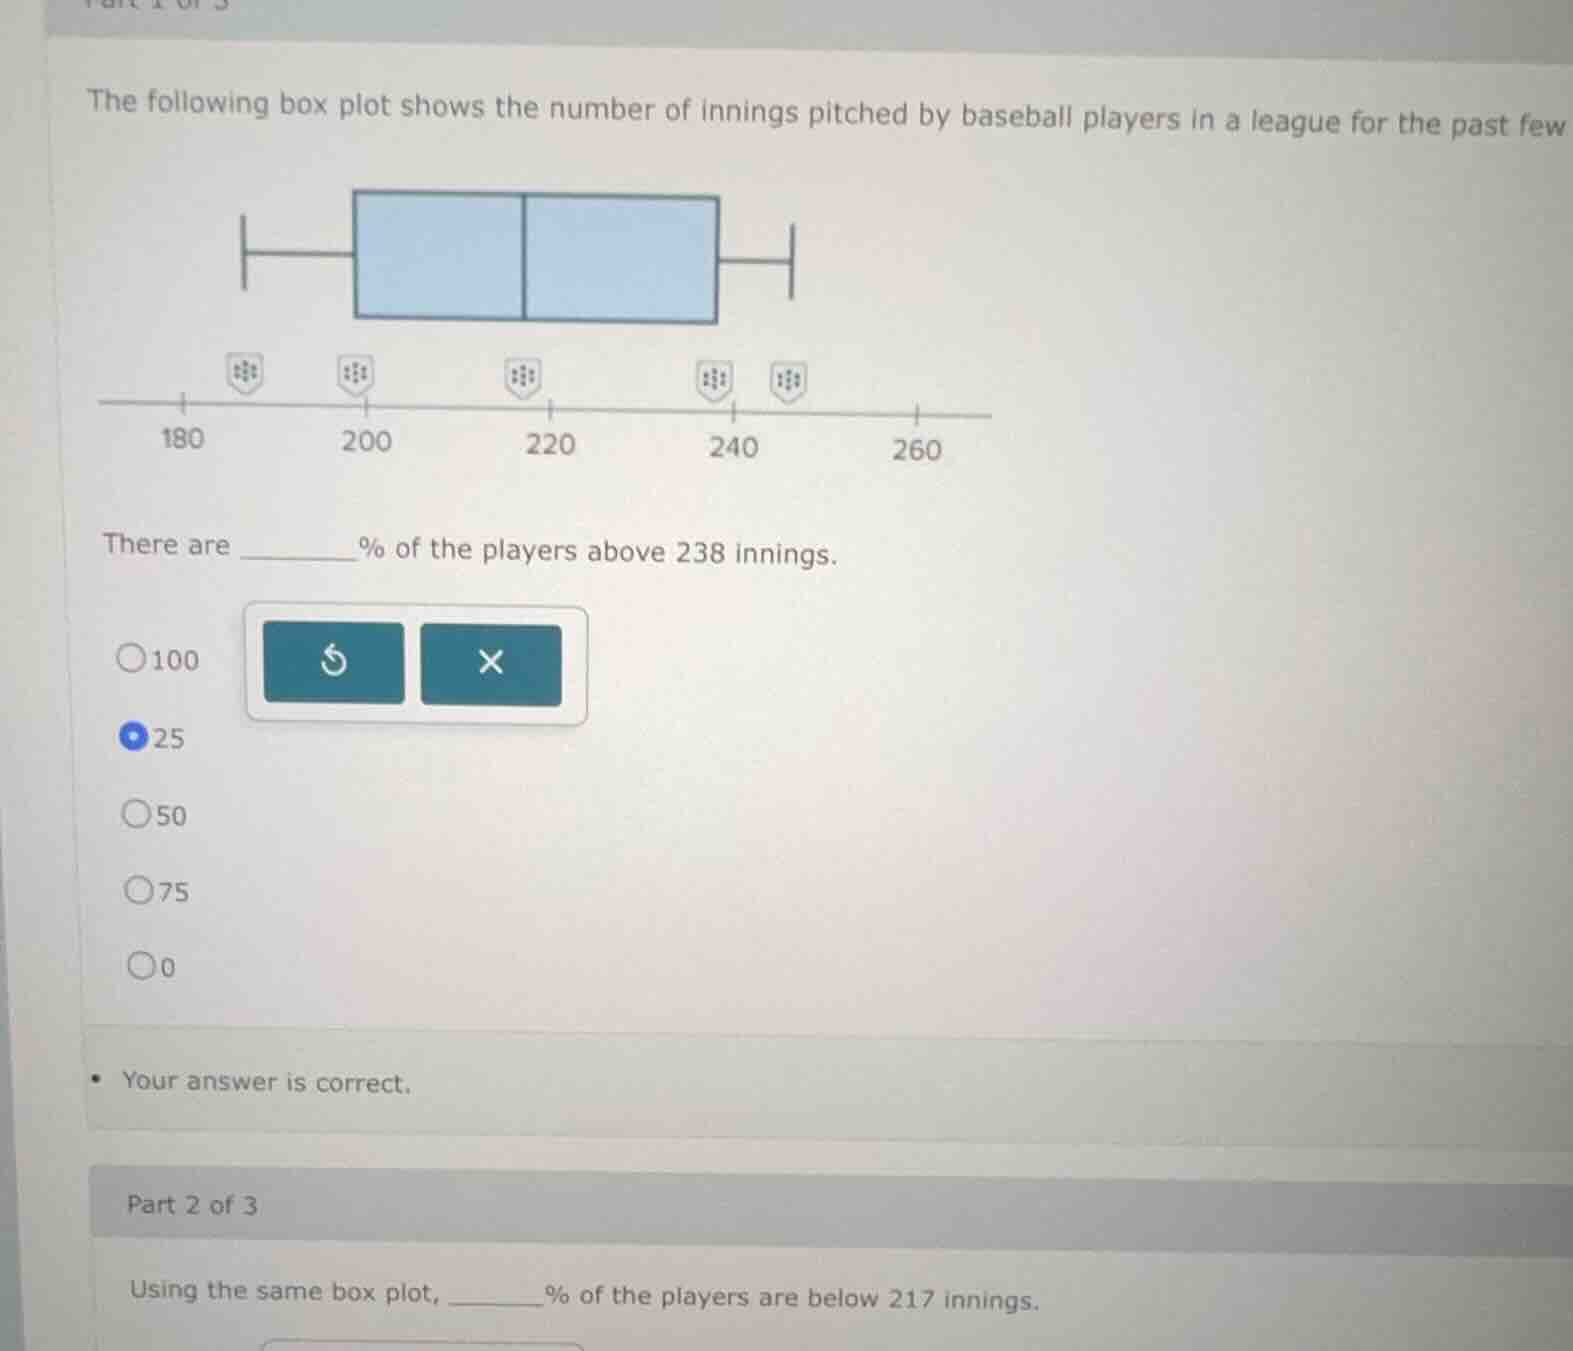
the following box plot shows the number of innings pitched by baseball players in a league for the past fewthere are ____% of the players above 238 innings.○100○25○50○75○0your answer is correct.part 2 of 3using the same box plot, ____% of the players are below 217 innings.
Step1: Identify box plot quartiles
A box plot divides data into 4 equal parts: minimum (0th percentile), Q1 (25th percentile, end of left box), median (50th percentile, middle line), Q3 (75th percentile, end of right box), maximum (100th percentile).
Step2: Map 217 to Q1
217 aligns with Q1 (25th percentile), meaning 25% of data lies below this value.

Snap & solve any problem in the app
Get step-by-step solutions on Sovi AI
Photo-based solutions with guided steps
Explore more problems and detailed explanations
25