QUESTION IMAGE
Question
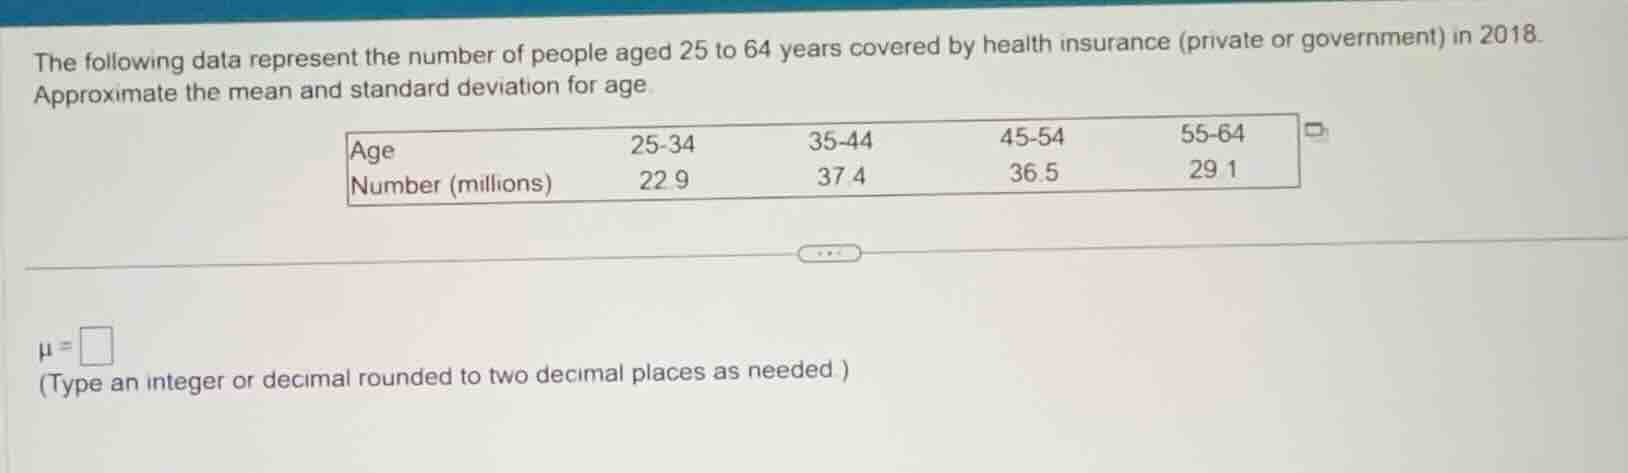
the following data represent the number of people aged 25 to 64 years covered by health insurance (private or government) in 2018. approximate the mean and standard deviation for age.
age 25 - 34 35 - 44 45 - 54 55 - 64
number (millions) 22.9 37.4 36.5 29.1
μ =
(type an integer or decimal rounded to two decimal places as needed )
Step1: Find midpoints of each age group
For 25 - 34, midpoint \( x_1=\frac{25 + 34}{2}=29.5 \)
For 35 - 44, midpoint \( x_2=\frac{35 + 44}{2}=39.5 \)
For 45 - 54, midpoint \( x_3=\frac{45 + 54}{2}=49.5 \)
For 55 - 64, midpoint \( x_4=\frac{55 + 64}{2}=59.5 \)
Step2: Calculate total number of people (\( N \))
\( N = 22.9+37.4 + 36.5+29.1=125.9 \) (millions)
Step3: Calculate weighted sum (\( \sum x_i f_i \))
\( \sum x_i f_i=(29.5\times22.9)+(39.5\times37.4)+(49.5\times36.5)+(59.5\times29.1) \)
\( = 29.5\times22.9 = 675.55 \)
\( 39.5\times37.4 = 1477.3 \)
\( 49.5\times36.5 = 1806.75 \)
\( 59.5\times29.1 = 1731.45 \)
Sum: \( 675.55 + 1477.3+1806.75 + 1731.45 = 5691.05 \)
Step4: Calculate mean (\( \mu \))
\( \mu=\frac{\sum x_i f_i}{N}=\frac{5691.05}{125.9}\approx45.20 \)

Snap & solve any problem in the app
Get step-by-step solutions on Sovi AI
Photo-based solutions with guided steps
Explore more problems and detailed explanations
\( 45.20 \)