QUESTION IMAGE
Question
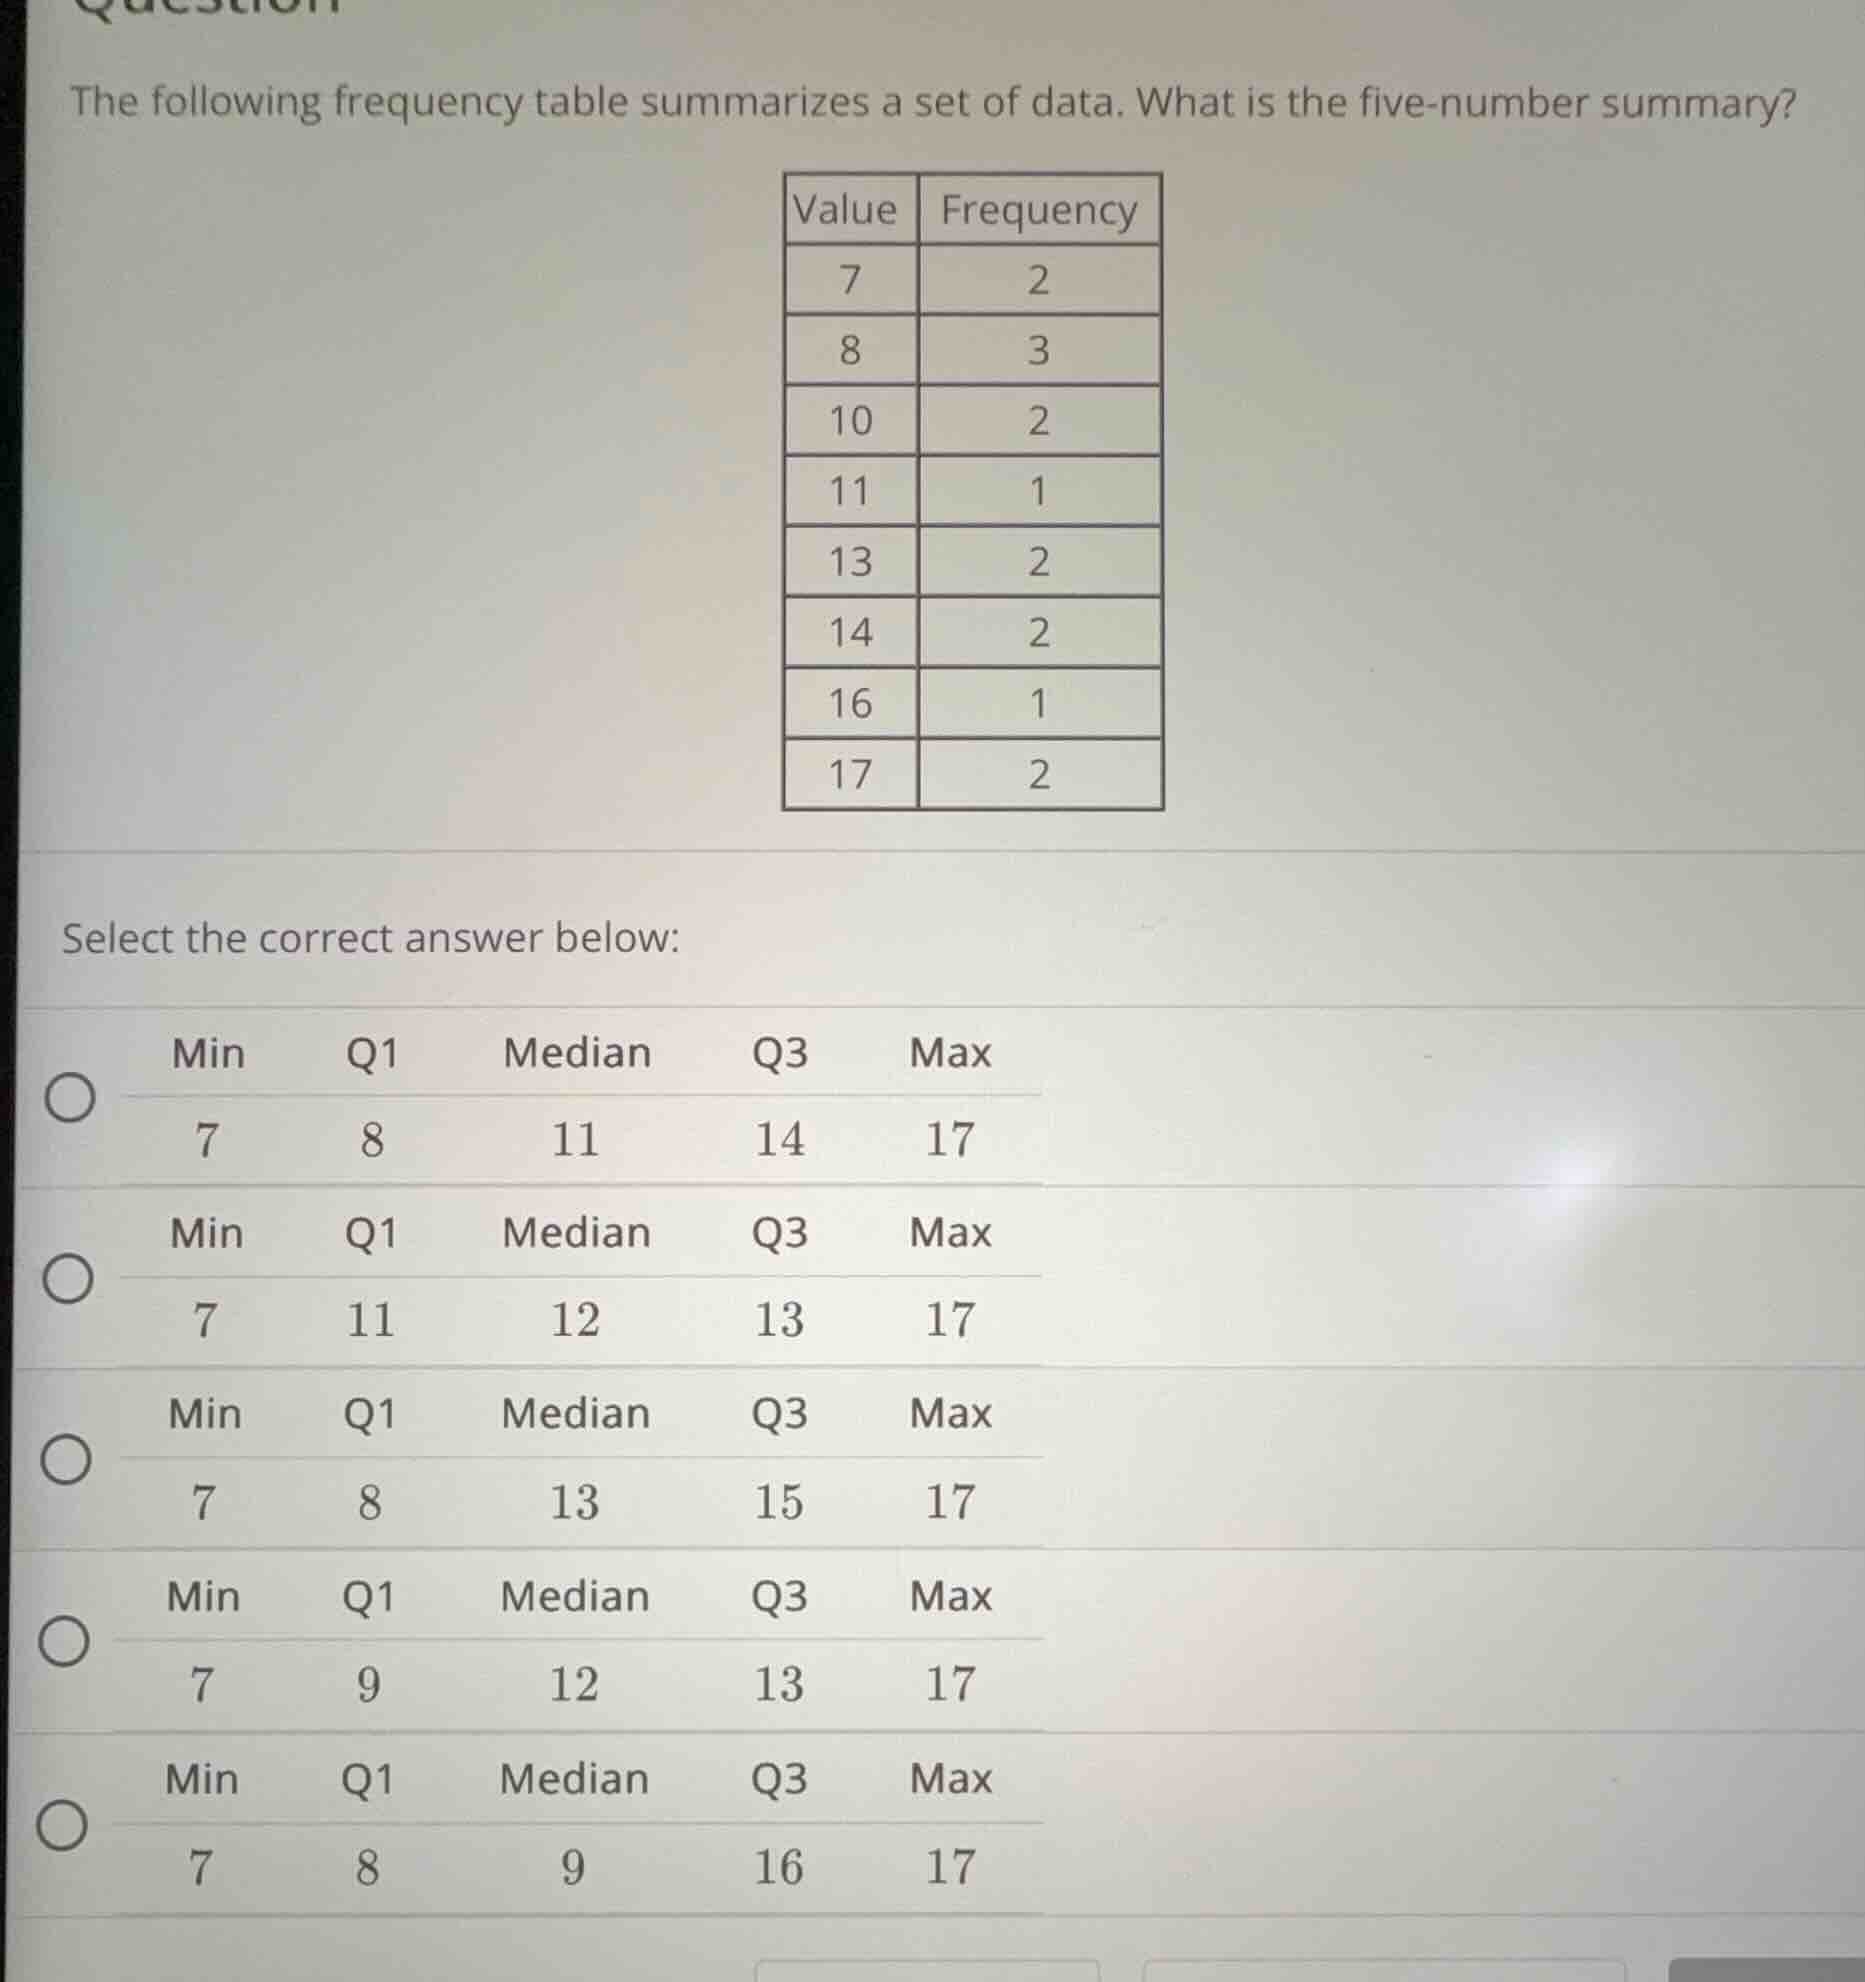
the following frequency table summarizes a set of data. what is the five - number summary?
| value | frequency |
|---|---|
| 8 | 3 |
| 10 | 2 |
| 11 | 1 |
| 13 | 2 |
| 14 | 2 |
| 16 | 1 |
| 17 | 2 |
select the correct answer below:
- min: 7, q1: 8, median: 11, q3: 14, max: 17
- min: 7, q1: 11, median: 12, q3: 13, max: 17
- min: 7, q1: 8, median: 13, q3: 15, max: 17
- min: 7, q1: 9, median: 12, q3: 13, max: 17
- min: 7, q1: 8, median: 9, q3: 16, max: 17
Step1: List the data points
First, we expand the frequency table into individual data points. For each value, we repeat it as many times as its frequency:
- Value 7: 7, 7 (2 times)
- Value 8: 8, 8, 8 (3 times)
- Value 10: 10, 10 (2 times)
- Value 11: 11 (1 time)
- Value 13: 13, 13 (2 times)
- Value 14: 14, 14 (2 times)
- Value 16: 16 (1 time)
- Value 17: 17, 17 (2 times)
Now, let's list all the data points in order:
7, 7, 8, 8, 8, 10, 10, 11, 13, 13, 14, 14, 16, 17, 17
Wait, let's check the total number of data points. Let's sum the frequencies: \(2 + 3 + 2 + 1 + 2 + 2 + 1 + 2 = 15\) data points. So the ordered list is:
1: 7
2: 7
3: 8
4: 8
5: 8
6: 10
7: 10
8: 11
9: 13
10: 13
11: 14
12: 14
13: 16
14: 17
15: 17
Step2: Find the minimum (Min)
The smallest value in the data set is 7. So Min = 7.
Step3: Find the maximum (Max)
The largest value in the data set is 17. So Max = 17.
Step4: Find the median (Median)
The median is the middle value of the ordered data set. Since there are 15 data points (odd number), the median is the \((\frac{15 + 1}{2}) = 8\)-th value. Looking at the ordered list:
1: 7
2: 7
3: 8
4: 8
5: 8
6: 10
7: 10
8: 11
So the median is 11? Wait, no, wait. Wait, let's recount the positions. Wait, 15 data points: positions 1 to 15. The middle position is \(\frac{15 + 1}{2} = 8\). So the 8th value:
Let's list the positions with their values:
1: 7
2: 7
3: 8
4: 8
5: 8
6: 10
7: 10
8: 11
9: 13
10: 13
11: 14
12: 14
13: 16
14: 17
15: 17
Yes, the 8th value is 11. Wait, but let's check the cumulative frequency.
Alternatively, cumulative frequency:
- 7: cumulative frequency 2
- 8: cumulative frequency 2 + 3 = 5
- 10: cumulative frequency 5 + 2 = 7
- 11: cumulative frequency 7 + 1 = 8
- 13: cumulative frequency 8 + 2 = 10
- 14: cumulative frequency 10 + 2 = 12
- 16: cumulative frequency 12 + 1 = 13
- 17: cumulative frequency 13 + 2 = 15
So the 8th value is 11, so median is 11.
Step5: Find Q1 (First Quartile)
Q1 is the median of the lower half of the data. The lower half consists of the first 7 data points (since 15 data points, the lower half is positions 1 to 7, because the median is at position 8). Wait, actually, for odd number of data points, the lower half is the first \(\frac{n - 1}{2}\) data points. Here, \(n = 15\), so \(\frac{15 - 1}{2} = 7\) data points. So the lower half is positions 1 to 7:
1: 7
2: 7
3: 8
4: 8
5: 8
6: 10
7: 10
The median of these 7 data points is the 4th value (since \(\frac{7 + 1}{2} = 4\)). So the 4th value in the lower half:
1: 7
2: 7
3: 8
4: 8
So Q1 is 8.
Step6: Find Q3 (Third Quartile)
Q3 is the median of the upper half of the data. The upper half consists of the last 7 data points (positions 9 to 15):
9: 13
10: 13
11: 14
12: 14
13: 16
14: 17
15: 17
The median of these 7 data points is the 4th value (since \(\frac{7 + 1}{2} = 4\)). So the 4th value in the upper half:
9: 13
10: 13
11: 14
12: 14
So Q3 is 14.
Putting it all together: Min = 7, Q1 = 8, Median = 11, Q3 = 14, Max = 17.

Snap & solve any problem in the app
Get step-by-step solutions on Sovi AI
Photo-based solutions with guided steps
Explore more problems and detailed explanations
Min: 7, Q1: 8, Median: 11, Q3: 14, Max: 17 (corresponding to the first option: Min 7, Q1 8, Median 11, Q3 14, Max 17)