QUESTION IMAGE
Question
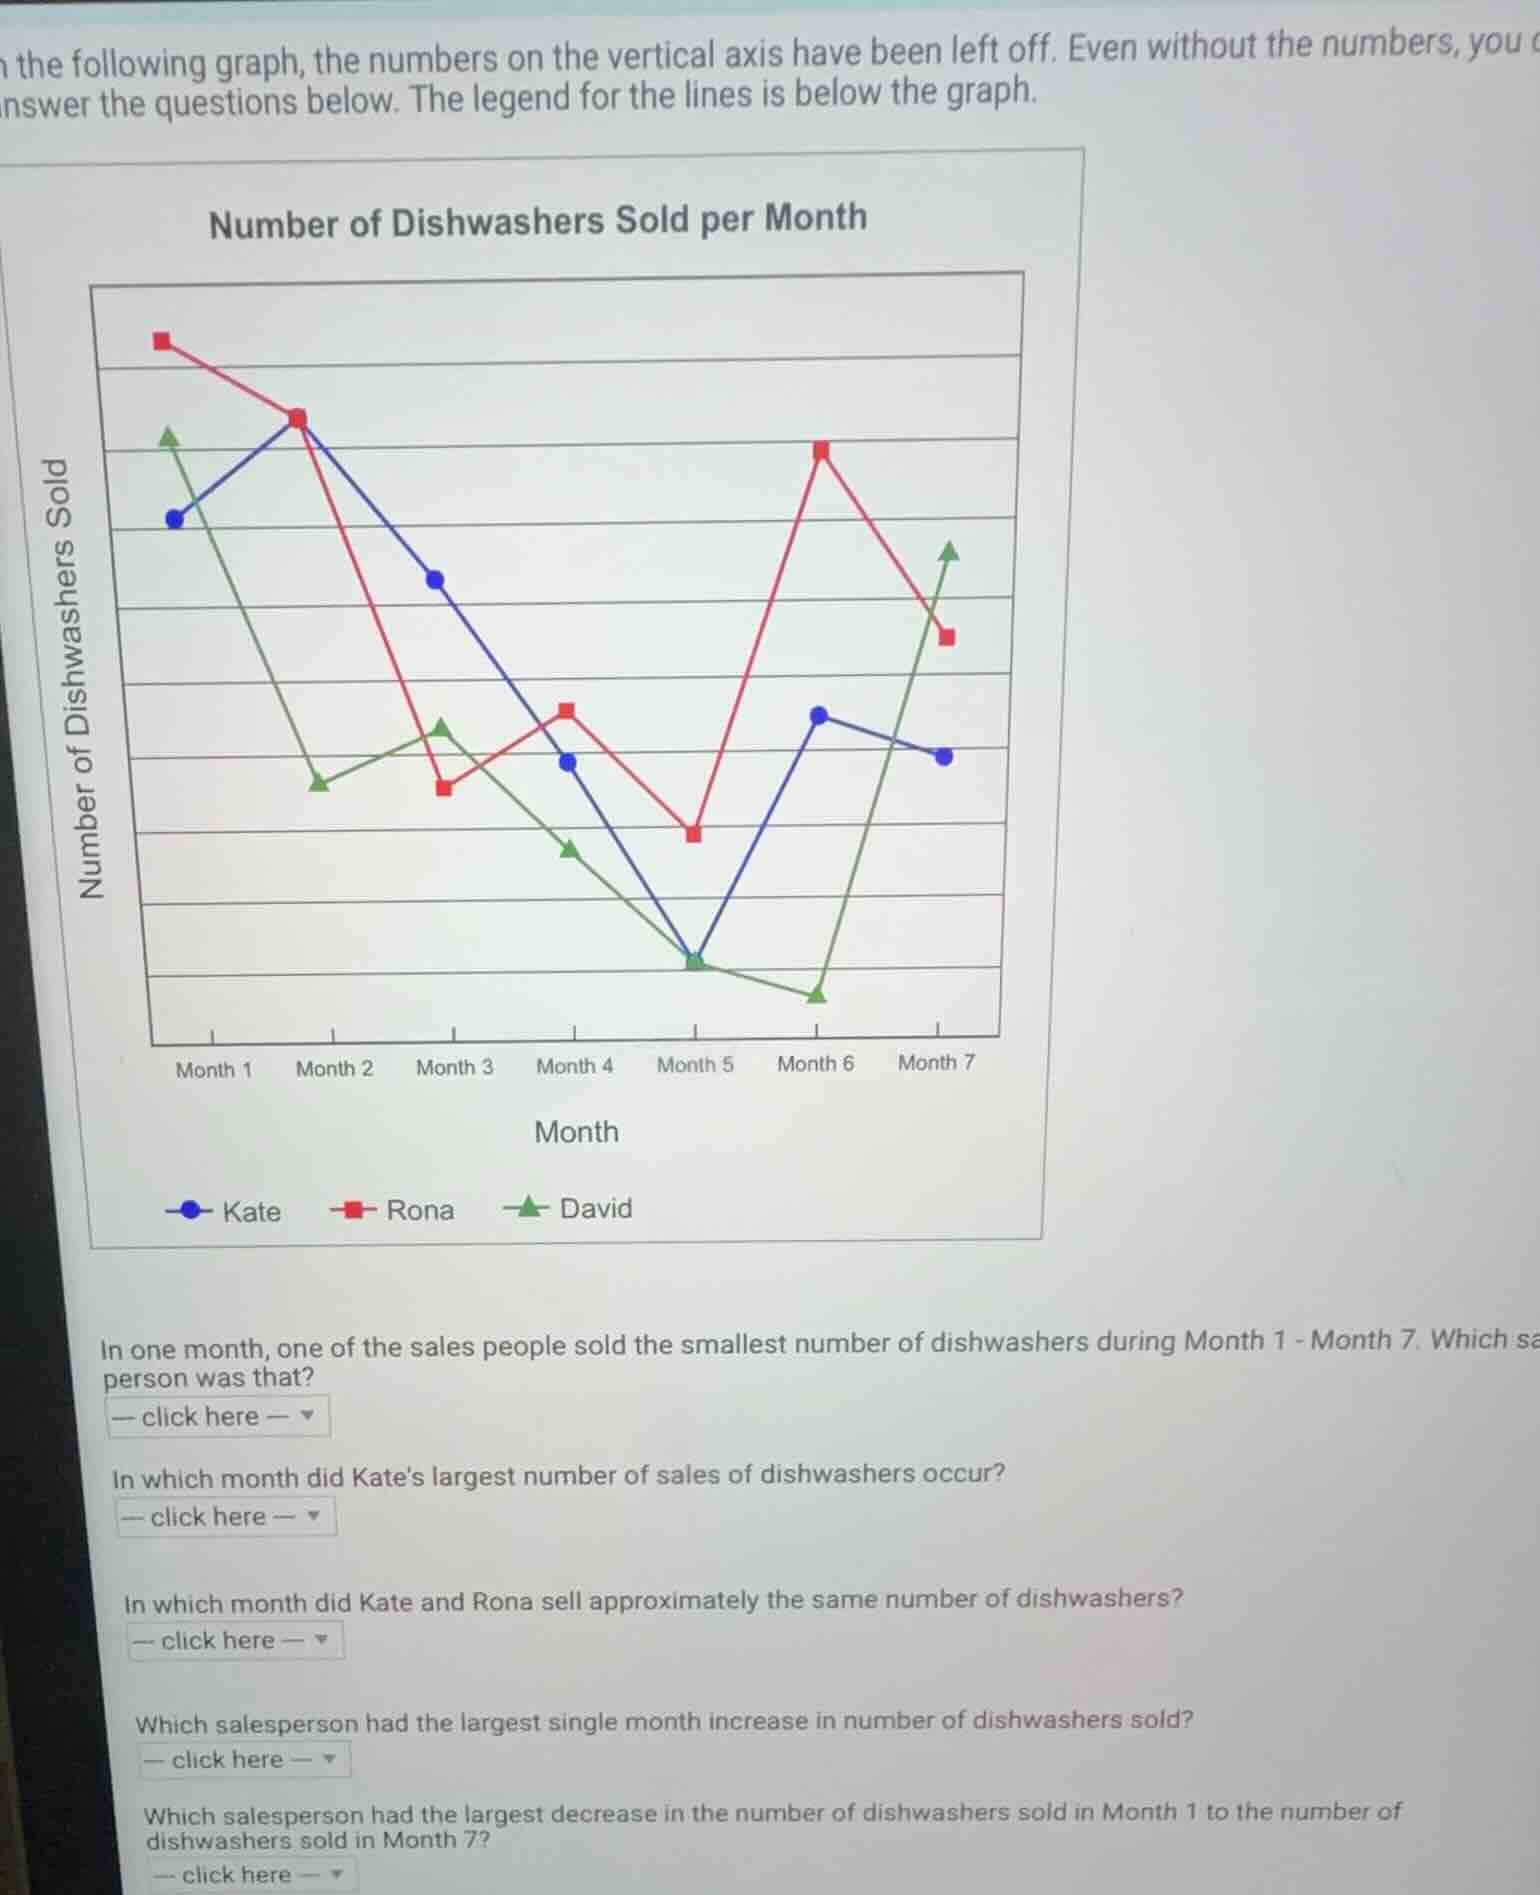
in the following graph, the numbers on the vertical axis have been left off. even without the numbers, you can answer the questions below. the legend for the lines is below the graph.
number of dishwashers sold per month
graph of number of dishwashers sold per month by kate, rona, and david from month 1 to month 7
legend:
- kate (blue circle)
- rona (red square)
- david (green triangle)
- in one month, one of the sales people sold the smallest number of dishwashers during month 1 - month 7. which salesperson was that?
dropdown menu: -- click here --
- in which month did kates largest number of sales of dishwashers occur?
dropdown menu: -- click here --
- in which month did kate and rona sell approximately the same number of dishwashers?
dropdown menu: -- click here --
- which salesperson had the largest single month increase in number of dishwashers sold?
dropdown menu: -- click here --
- which salesperson had the largest decrease in the number of dishwashers sold in month 1 to the number of dishwashers sold in month 7?
dropdown menu: -- click here --
Brief Explanations
- For the smallest single-month sale: David's Month 6 point is the lowest on the graph.
- For Kate's largest sale: Her Month 2 point is the highest among her data points.
- For matching sales of Kate and Rona: Their data points align closest in Month 2.
- For largest single-month increase: Rona's sales jump from Month 5 to Month 6 is the steepest upward change.
- For largest Month 1 to Month 7 decrease: David's Month 1 sales are high, and his Month 7 sales are much lower, showing the biggest drop between these two months.

Snap & solve any problem in the app
Get step-by-step solutions on Sovi AI
Photo-based solutions with guided steps
Explore more problems and detailed explanations
- David
- Month 2
- Month 2
- Rona
- David