QUESTION IMAGE
Question
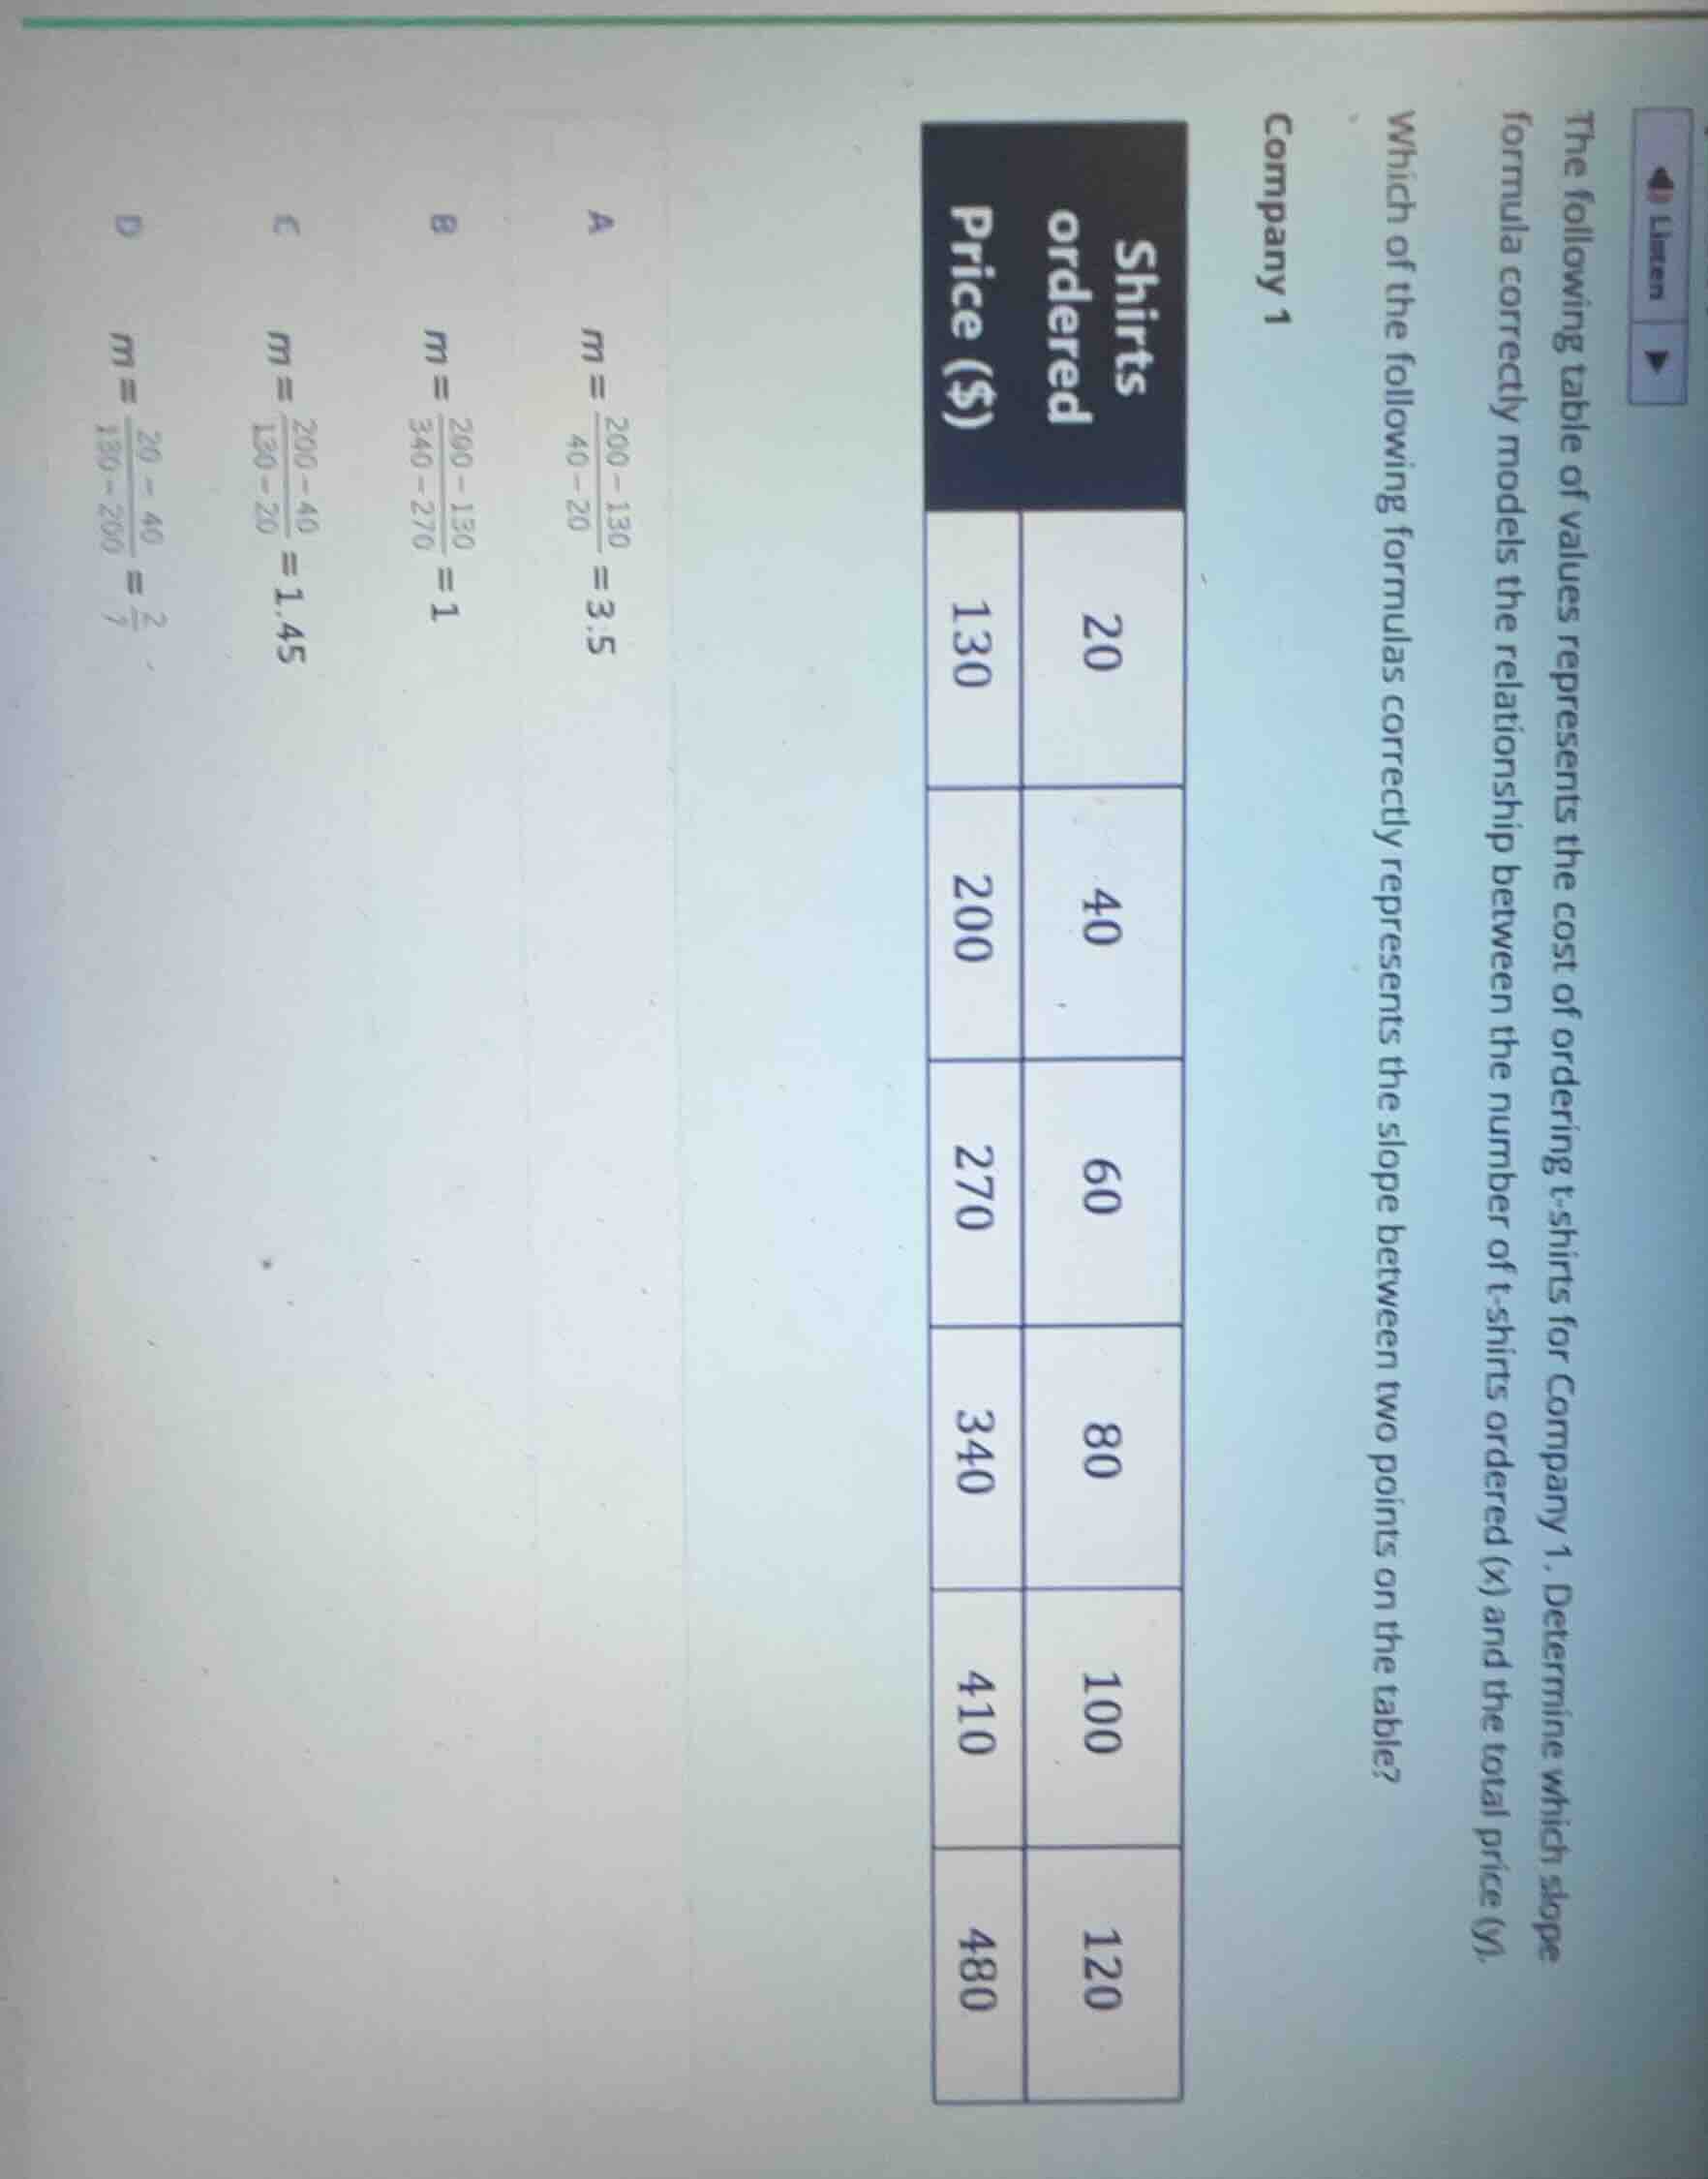
the following table of values represents the cost of ordering t - shirts for company 1. determine which slope formula correctly models the relationship between the number of t - shirts ordered (x) and the total price (y). which of the following formulas correctly represents the slope between two points on the table? company 1
| shirts ordered | price ($) |
|---|---|
| 40 | 200 |
| 60 | 270 |
| 80 | 340 |
| 100 | 410 |
| 120 | 480 |
a ( m=\frac{200 - 130}{40 - 20}=3.5 )
b ( m=\frac{200 - 130}{340 - 270}=1 )
c ( m=\frac{200 - 40}{130 - 20}=1.45 )
d ( m=\frac{20 - 40}{130 - 200}=\frac{2}{7} )
Step1: Recall slope formula
Slope $m = \frac{y_2 - y_1}{x_2 - x_1}$, where $(x_1,y_1)$ and $(x_2,y_2)$ are table points.
Step2: Pick two valid points
Choose $(x_1,y_1)=(20,130)$ and $(x_2,y_2)=(40,200)$.
Step3: Calculate slope
$m = \frac{200 - 130}{40 - 20} = \frac{70}{20} = 3.5$
Step4: Match to options
This matches option A's calculation.

Snap & solve any problem in the app
Get step-by-step solutions on Sovi AI
Photo-based solutions with guided steps
Explore more problems and detailed explanations
A. $m = \frac{200 - 130}{40 - 20} = 3.5$