QUESTION IMAGE
Question
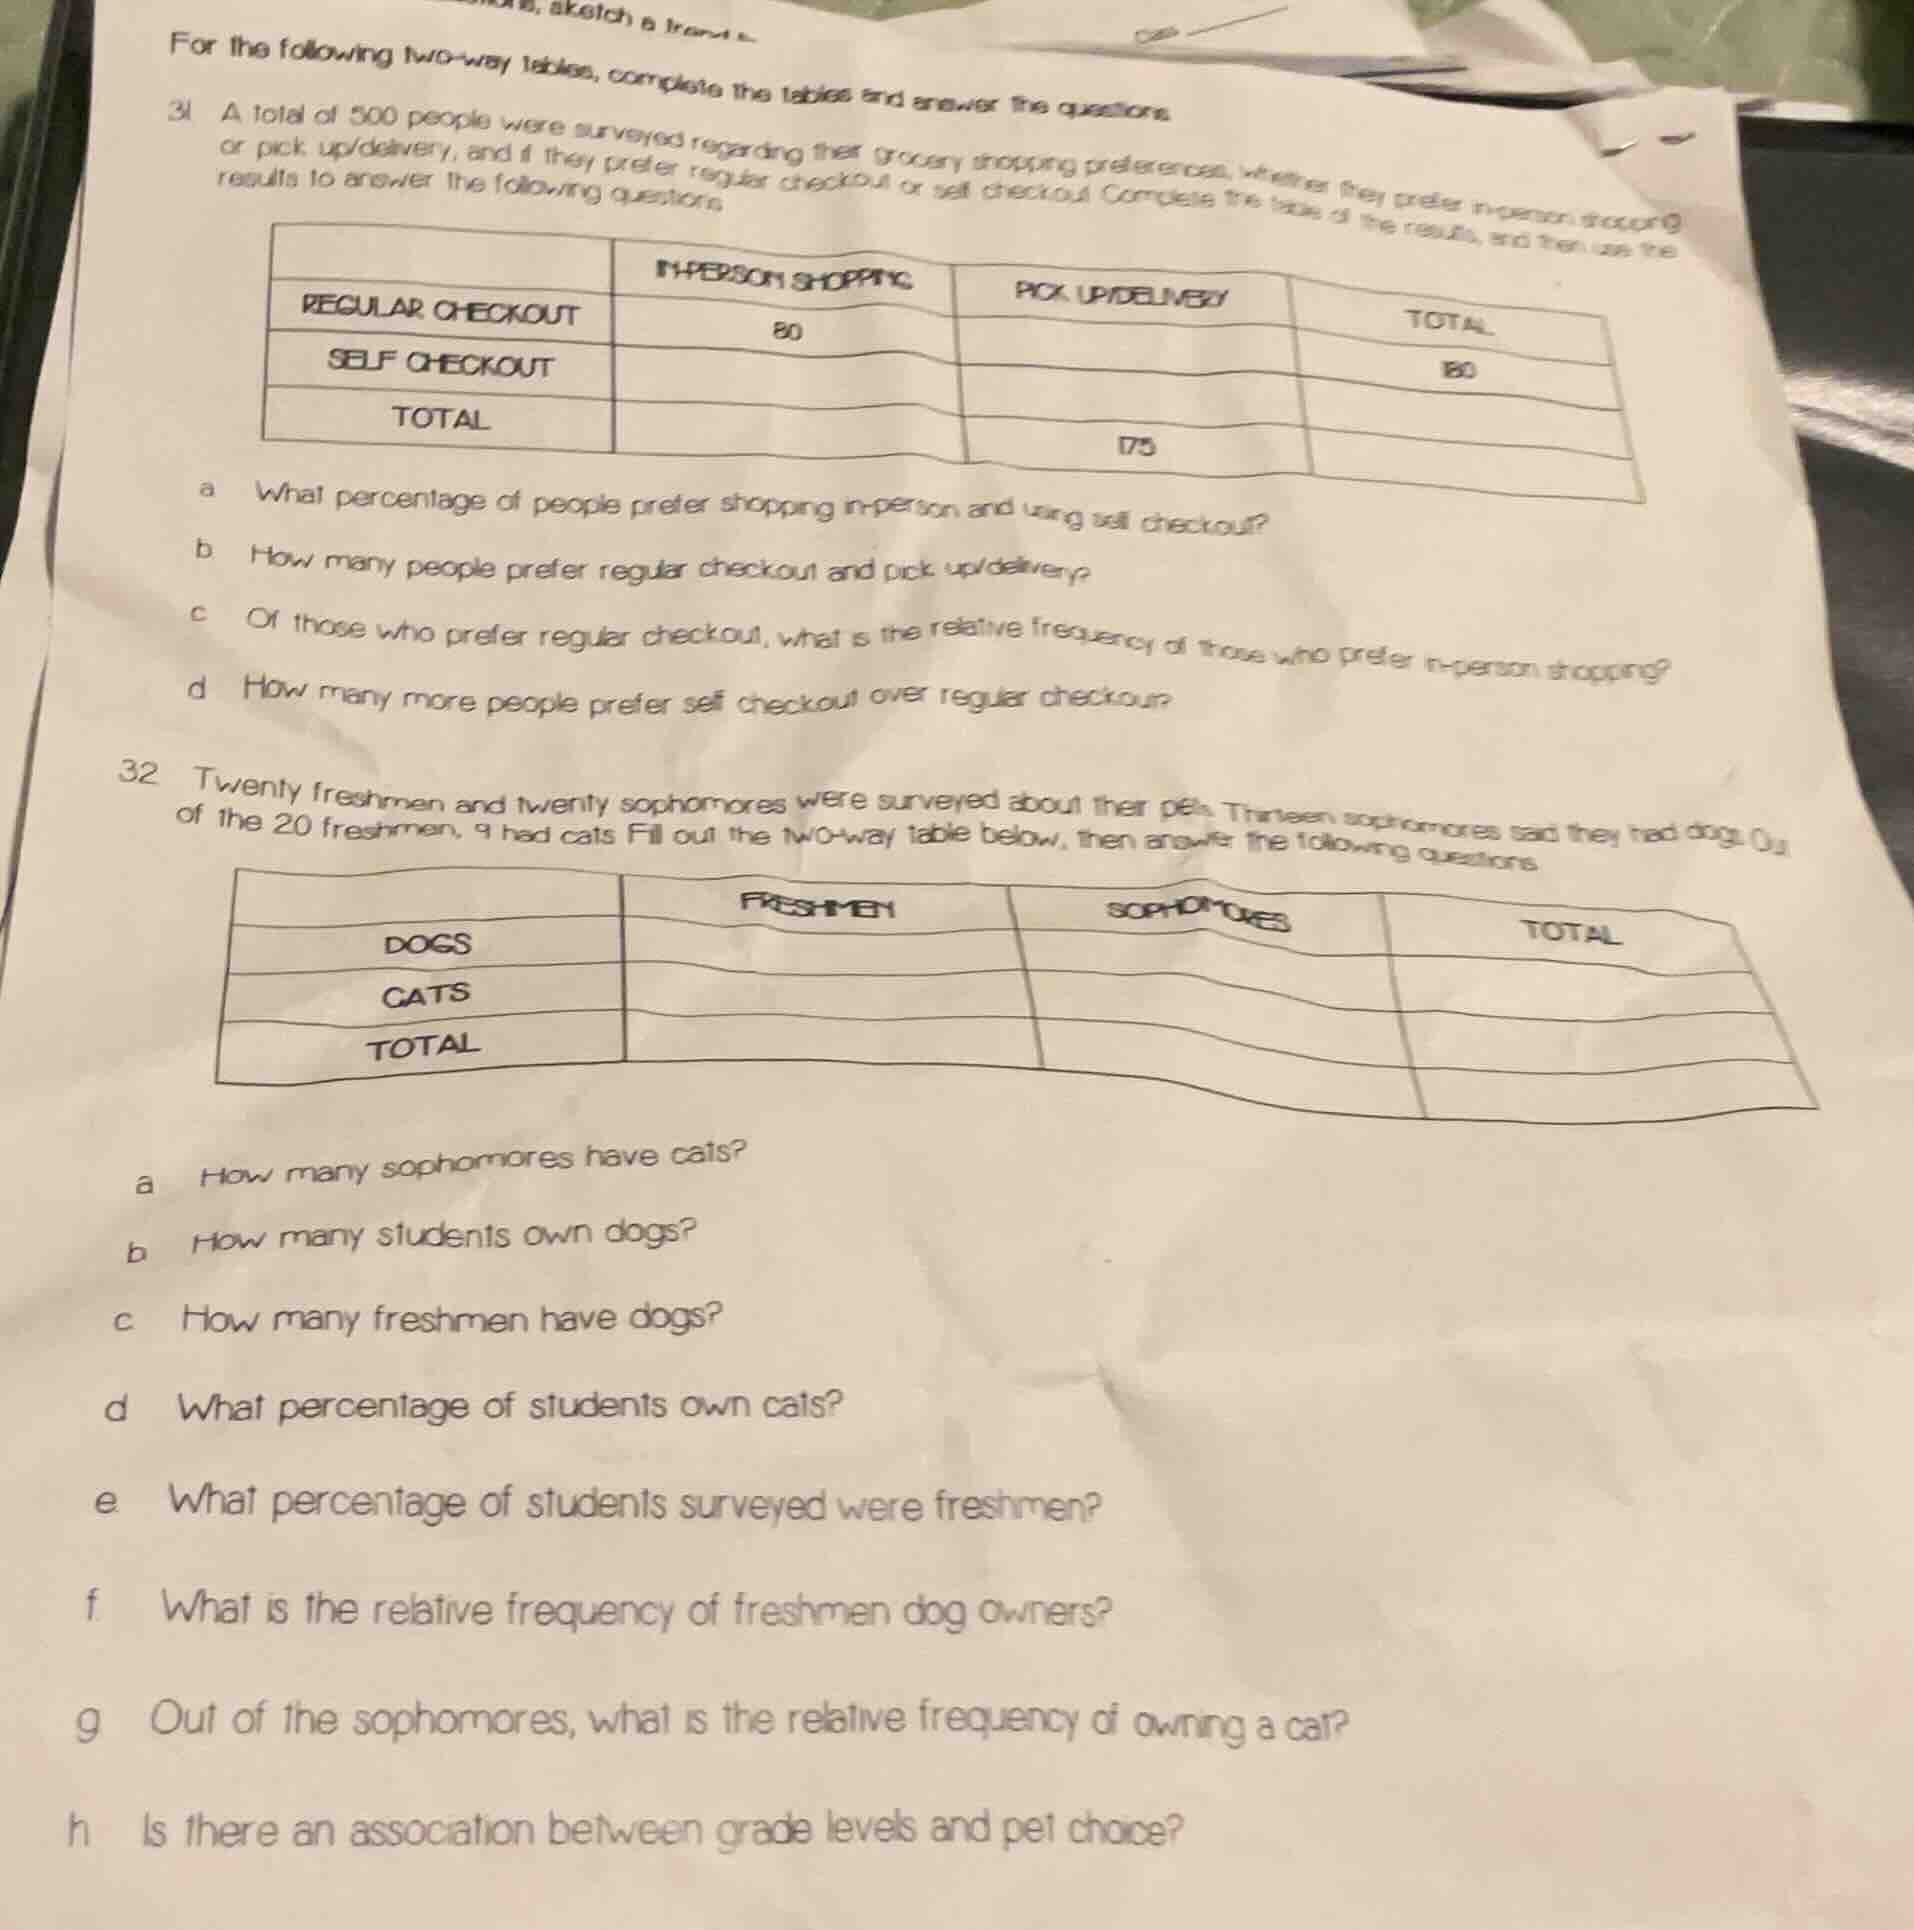
for the following two - way tables, complete the tables and answer the questions.
31 a total of 500 people were surveyed regarding their grocery shopping preferences, whether they prefer in - person shopping or pick - up/delivery, and if they prefer regular checkout or self - checkout. complete the table of the results, and then use the results to answer the following questions
| in - person shopping | pick - up/delivery | total | |
|---|---|---|---|
| self checkout | |||
| total | 175 |
a what percentage of people prefer shopping in - person and using self - checkout?
b how many people prefer regular checkout and pick - up/delivery?
c of those who prefer regular checkout, what is the relative frequency of those who prefer in - person shopping?
d how many more people prefer self - checkout over regular checkout?
32 twenty freshmen and twenty sophomores were surveyed about their pets. thirteen sophomores said they had dogs. out of the 20 freshmen, 9 had cats. fill out the two - way table below, then answer the following questions.
| freshmen | sophomores | total | |
|---|---|---|---|
| cats | |||
| total |
a how many sophomores have cats?
b how many students own dogs?
c how many freshmen have dogs?
d what percentage of students own cats?
e what percentage of students surveyed were freshmen?
f what is the relative frequency of freshmen dog owners?
g out of the sophomores, what is the relative frequency of owning a cat?
h is there an association between grade levels and pet choice?
Problem 31
Step1: Complete the two-way table
First, total surveyed = 500.
- Total pick up/delivery = 175, so total in-person = $500 - 175 = 325$
- Regular checkout total: $180$ (given total regular), so self checkout total = $500 - 180 = 320$
- In-person self checkout = $325 - 80 = 245$
- Pick up/delivery regular checkout = $180 - 80 = 100$
- Pick up/delivery self checkout = $175 - 100 = 75$
Final table:
| IN-PERSON SHOPPING | PICK UP/DELIVERY | TOTAL | |
|---|---|---|---|
| SELF CHECKOUT | 245 | 75 | 320 |
| TOTAL | 325 | 175 | 500 |
Step2: Solve part (a)
Find % of in-person + self checkout:
$\text{Percentage} = \frac{245}{500} \times 100\% = 49\%$
Step3: Solve part (b)
From table, regular + pick up/delivery = 100
Step4: Solve part (c)
Relative frequency (in-person regular / total regular):
$\text{Relative Frequency} = \frac{80}{180} = \frac{4}{9} \approx 0.444$
Step5: Solve part (d)
Difference: $320 - 180 = 140$
Step1: Complete the two-way table
Total freshmen = 20, total sophomores = 20, total surveyed = 40.
- Freshmen with cats = 9, so freshmen with dogs = $20 - 9 = 11$
- Sophomores with dogs = 13, so sophomores with cats = $20 - 13 = 7$
- Total dog owners = $11 + 13 = 24$
- Total cat owners = $9 + 7 = 16$
Final table:
| FRESHMEN | SOPHOMORES | TOTAL | |
|---|---|---|---|
| CATS | 9 | 7 | 16 |
| TOTAL | 20 | 20 | 40 |
Step2: Solve part (a)
Sophomores with cats = 7
Step3: Solve part (b)
Total dog owners = 24
Step4: Solve part (c)
Freshmen with dogs = 11
Step5: Solve part (d)
% of cat owners: $\frac{16}{40} \times 100\% = 40\%$
Step6: Solve part (e)
% of freshmen: $\frac{20}{40} \times 100\% = 50\%$
Step7: Solve part (f)
Relative frequency (freshmen dogs / total dog owners):
$\frac{11}{24} \approx 0.458$
Step8: Solve part (g)
Relative frequency (sophomore cats / total sophomores):
$\frac{7}{20} = 0.35$
Step9: Solve part (h)
Compare pet preference rates:
- Freshmen cat rate: $\frac{9}{20}=45\%$, dog rate: $\frac{11}{20}=55\%$
- Sophomore cat rate: $\frac{7}{20}=35\%$, dog rate: $\frac{13}{20}=65\%$
Sophomores are more likely to own dogs, freshmen more likely to own cats, so yes, there is an association.

Snap & solve any problem in the app
Get step-by-step solutions on Sovi AI
Photo-based solutions with guided steps
Explore more problems and detailed explanations
a. $49\%$
b. $100$
c. $\frac{4}{9}$ (or ~44.4%)
d. $140$
---