QUESTION IMAGE
Question
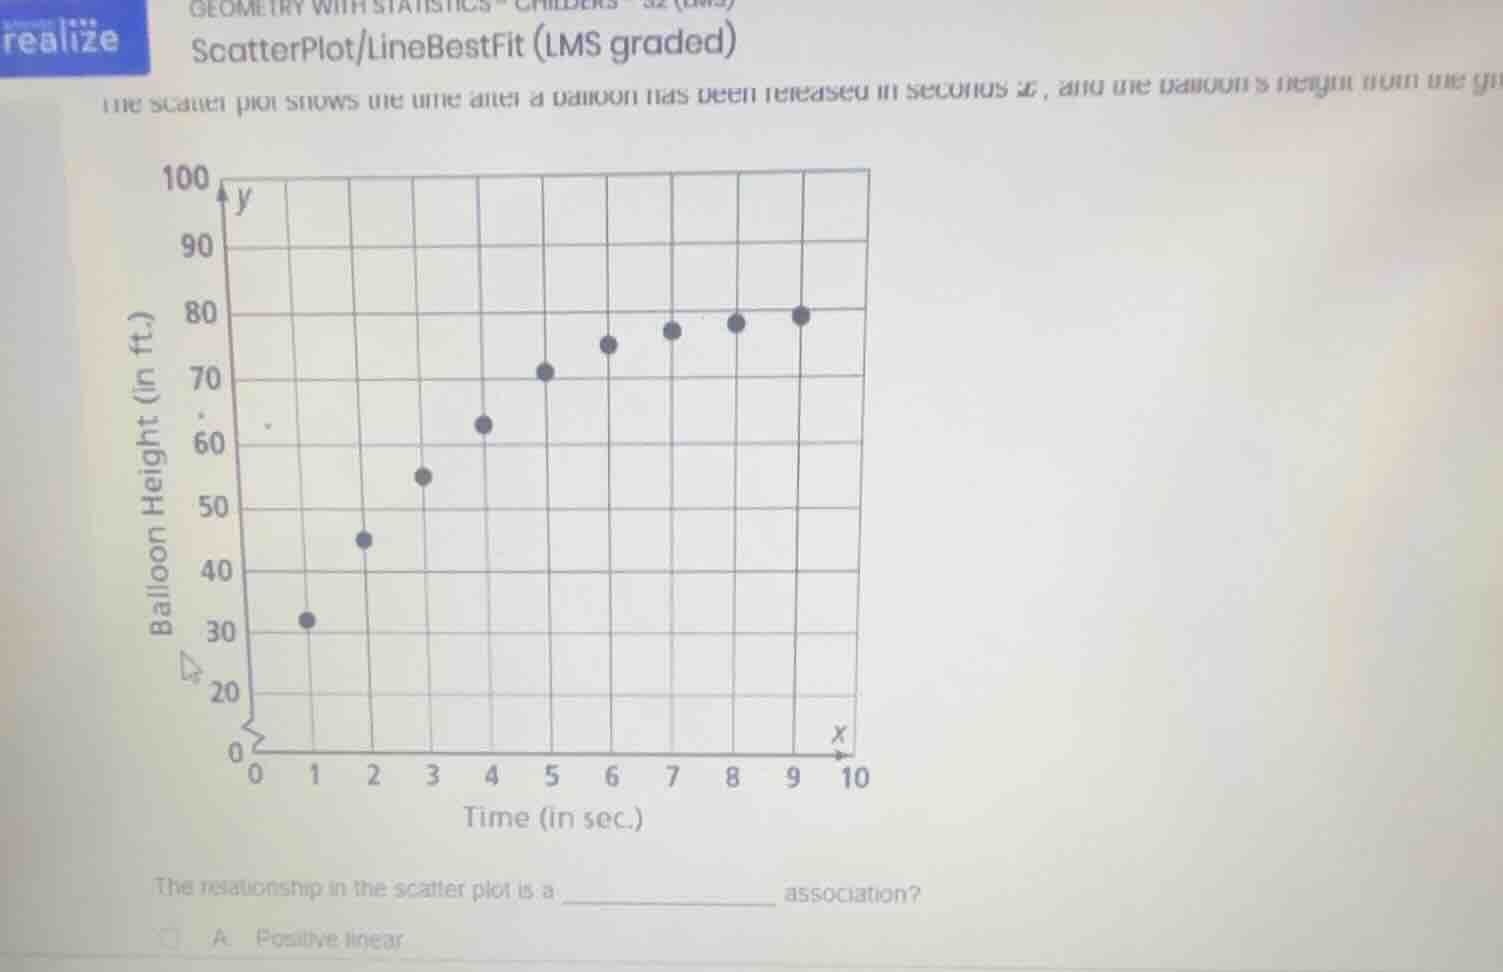
geometry with statisticsscatterplot/linebestfit (lms graded)the scatter plot shows the time after a balloon has been released in seconds $x$, and the balloons height from the ground.the relationship in the scatter plot is a _______________ association?a. positive linear
Brief Explanations
As time (x-value) increases, the balloon height (y-value) increases, and the points follow a roughly straight upward trend, which fits a positive linear association.

Snap & solve any problem in the app
Get step-by-step solutions on Sovi AI
Photo-based solutions with guided steps
Explore more problems and detailed explanations
A. Positive linear