QUESTION IMAGE
Question
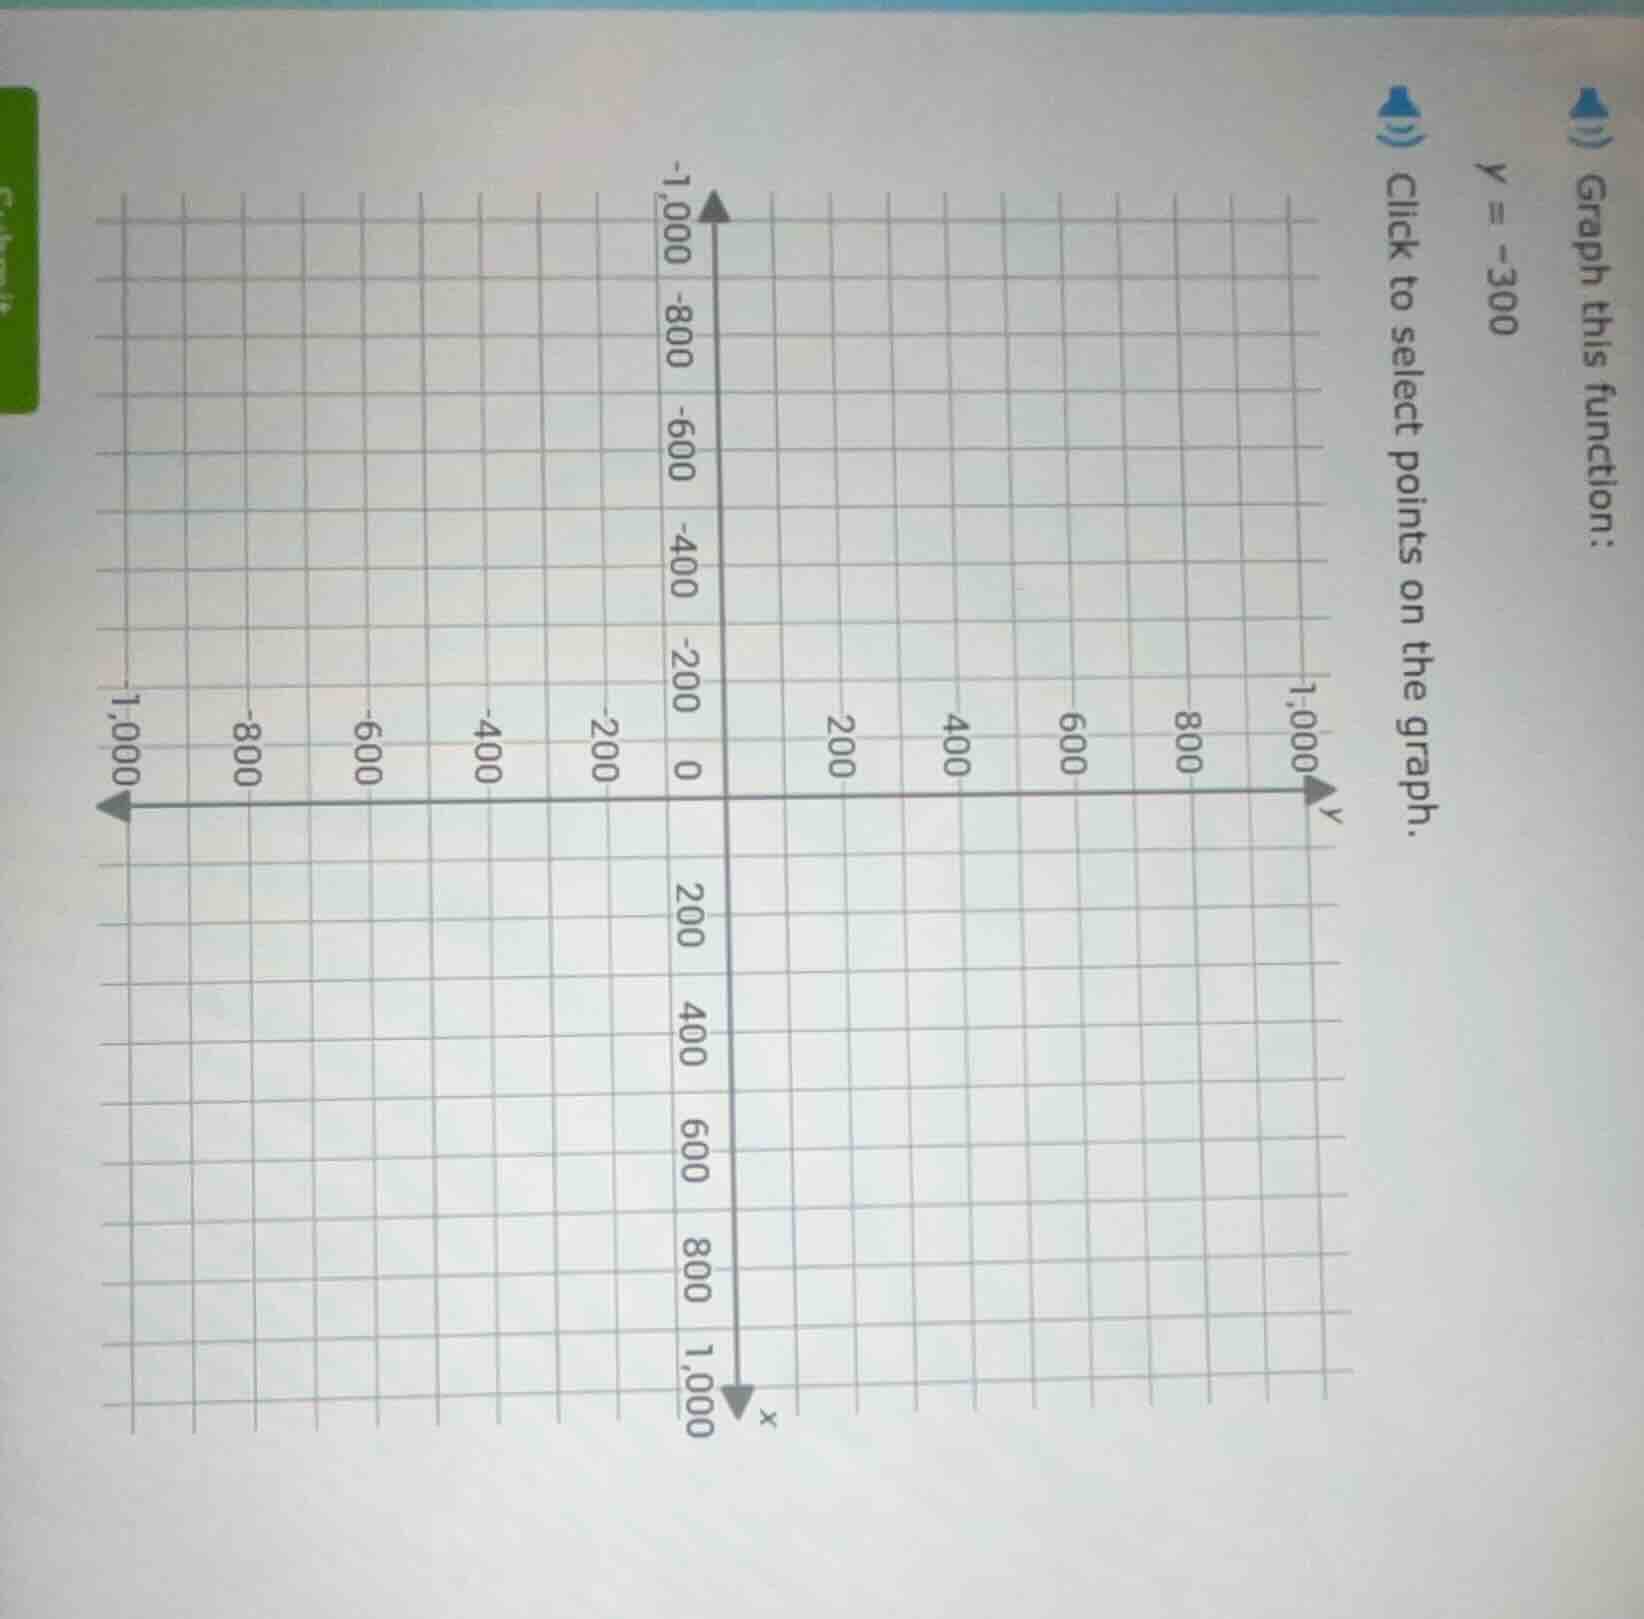
graph this function: y = -300 click to select points on the graph.
Step1: Identify function type
The function $y=-300$ is a horizontal line; for all $x$-values, $y$ equals $-300$.
Step2: Choose points for plotting
Select any two $x$-values, e.g., $x=0$ and $x=500$.
For $x=0$: $y=-300$, so point is $(0, -300)$
For $x=500$: $y=-300$, so point is $(500, -300)$
Step3: Plot and connect points
Draw a straight horizontal line through these points, extending across the entire grid.

Snap & solve any problem in the app
Get step-by-step solutions on Sovi AI
Photo-based solutions with guided steps
Explore more problems and detailed explanations
The graph is a horizontal line passing through all points where $y=-300$, such as $(0, -300)$ and $(500, -300)$, spanning the full range of the $x$-axis on the provided grid.