QUESTION IMAGE
Question
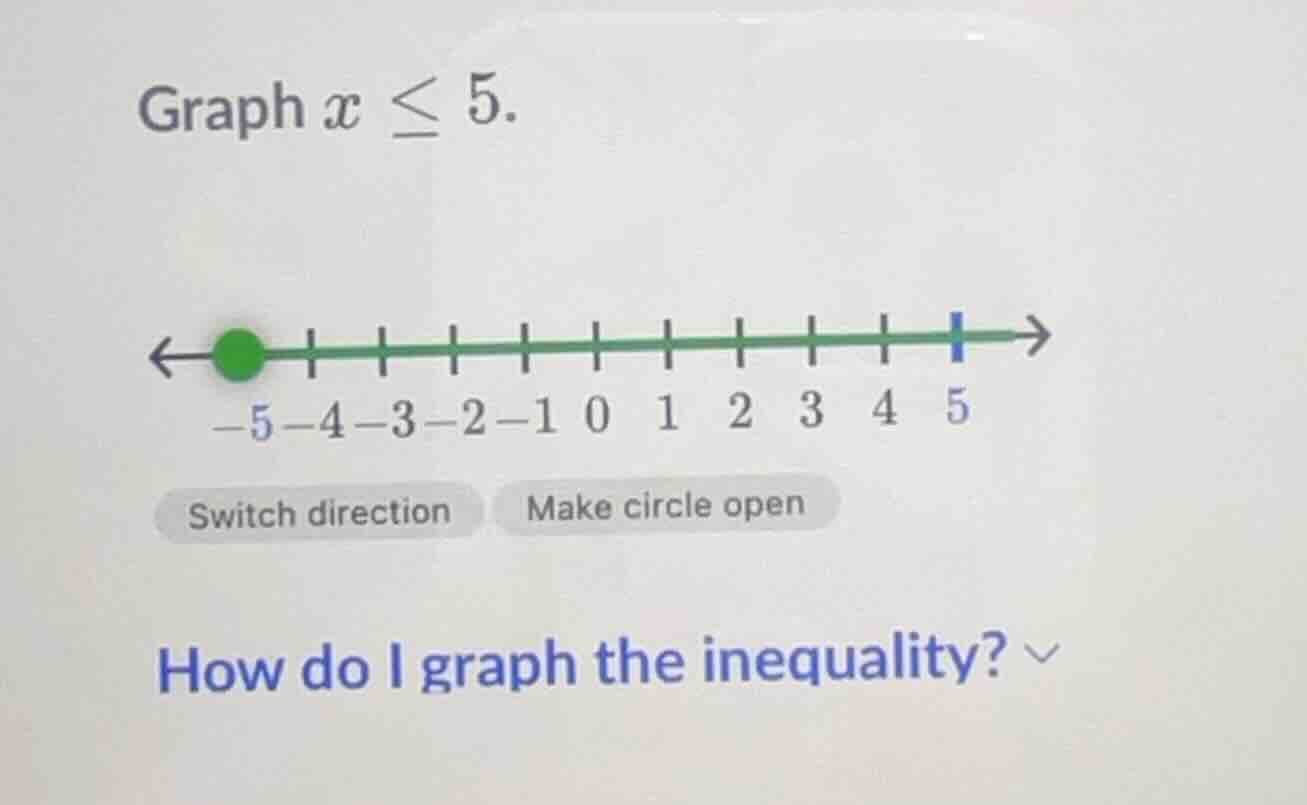
graph $x \leq 5$.
\leftarrow \boldsymbol{\circ} \text{---|---|---|---|---|---|---|---} \
ightarrow
-5 -4 -3 -2 -1 0 1 2 3 4 5
switch direction make circle open
how do i graph the inequality?
Step1: Analyze the inequality \(x \leq 5\)
The inequality \(x \leq 5\) means all real numbers less than or equal to 5. On a number line, we first identify the critical point, which is 5. Since the inequality is "less than or equal to", we use a closed (filled - in) circle at 5 to indicate that 5 is included in the solution set.
Step2: Determine the direction of the line
For \(x \leq 5\), the solution set includes all numbers to the left of 5 (since numbers to the left of 5 on the number line are less than 5) as well as 5 itself. So we draw a line starting from the closed circle at 5 and extending to the left.
Looking at the given number line, the green dot is at - 5, which is incorrect. The correct graph should have a closed circle at 5 and the line should extend to the left from 5. So we need to move the green dot (the closed circle) to 5 and then draw the line to the left from 5.

Snap & solve any problem in the app
Get step-by-step solutions on Sovi AI
Photo-based solutions with guided steps
Explore more problems and detailed explanations
To graph \(x\leq5\) correctly, place a closed (filled - in) circle at 5 (since \(x = 5\) is included in the solution set) and draw a line extending to the left from 5 to represent all numbers less than or equal to 5.