QUESTION IMAGE
Question
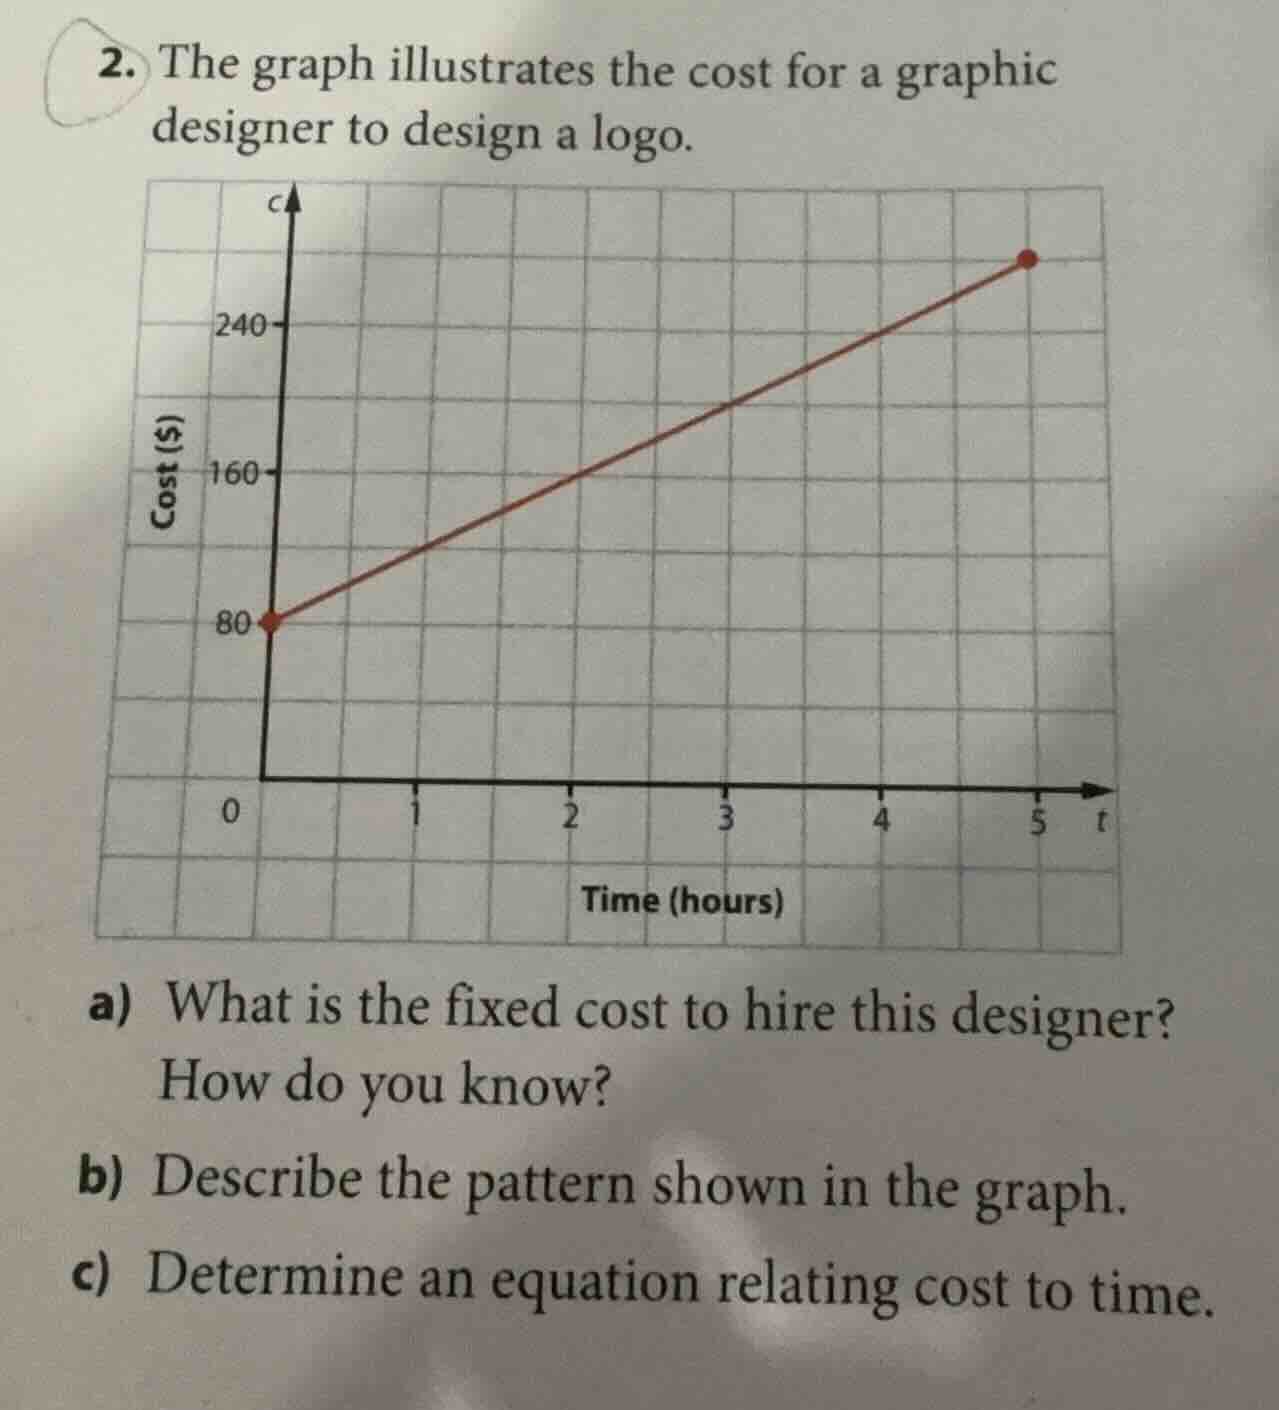
- the graph illustrates the cost for a graphic designer to design a logo.
a) what is the fixed cost to hire this designer? how do you know?
b) describe the pattern shown in the graph.
c) determine an equation relating cost to time.
Step1: Identify fixed cost (t=0)
The fixed cost is the cost when time $t=0$. From the graph, at $t=0$, $C=80$.
Step2: Describe linear cost pattern
The cost increases at a constant rate as time increases, starting from the fixed cost.
Step3: Calculate hourly rate
Find the slope (hourly rate) using two points: $(0,80)$ and $(5,280)$.
Slope $m = \frac{280-80}{5-0} = \frac{200}{5} = 40$
Step4: Form cost equation
Use slope-intercept form $C = mt + b$, where $b=80$ (fixed cost) and $m=40$.
$C = 40t + 80$

Snap & solve any problem in the app
Get step-by-step solutions on Sovi AI
Photo-based solutions with guided steps
Explore more problems and detailed explanations
a) The fixed cost is $\$80$. This is the cost when 0 hours are spent (the y-intercept of the graph, at $t=0$).
b) The cost starts at a fixed amount of $\$80$, and increases by a constant rate of $\$40$ for each additional hour of work, creating a straight, upward-sloping linear relationship between time and cost.
c) $C = 40t + 80$