QUESTION IMAGE
Question
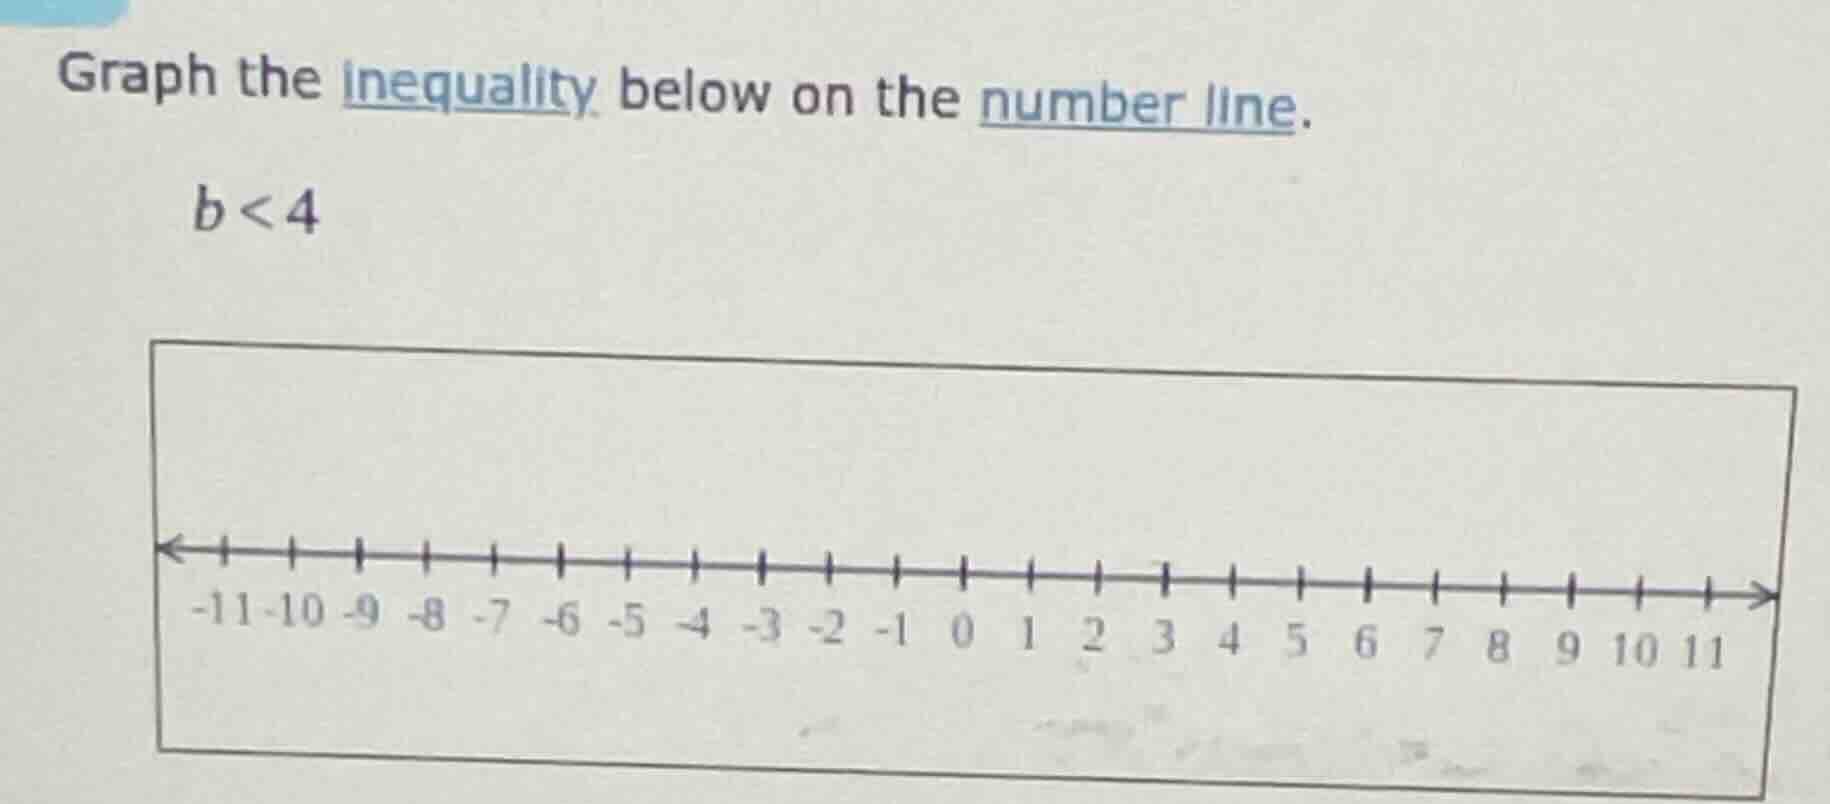
graph the inequality below on the number line.
$b < 4$
number line from -11 to 11 with ticks at each integer
Step1: Identify the critical point
The inequality is \( b < 4 \), so the critical value is 4. Since the inequality is strict (\(<\), not \(\leq\)), we use an open circle at 4 to indicate that 4 is not included in the solution set.
Step2: Determine the direction of the line
For \( b < 4 \), we shade all the numbers to the left of 4 on the number line because those are the values of \( b \) that are less than 4.
To graph it:
- Locate 4 on the number line.
- Draw an open circle at 4 (because \( b \) cannot be equal to 4).
- Draw a line with an arrow pointing to the left from the open circle to represent all numbers less than 4.

Snap & solve any problem in the app
Get step-by-step solutions on Sovi AI
Photo-based solutions with guided steps
Explore more problems and detailed explanations
To graph \( b < 4 \) on the number line:
- Place an open circle at \( 4 \) (since \( 4 \) is not included in the solution).
- Draw a ray (line with an arrow) starting from the open circle and extending to the left (toward negative infinity) to represent all values of \( b \) that are less than \( 4 \).
(Visually, on the given number line, the open circle is at the tick mark labeled \( 4 \), and the arrow points left past \( 3, 2, 1, 0, -1, \dots \))