QUESTION IMAGE
Question
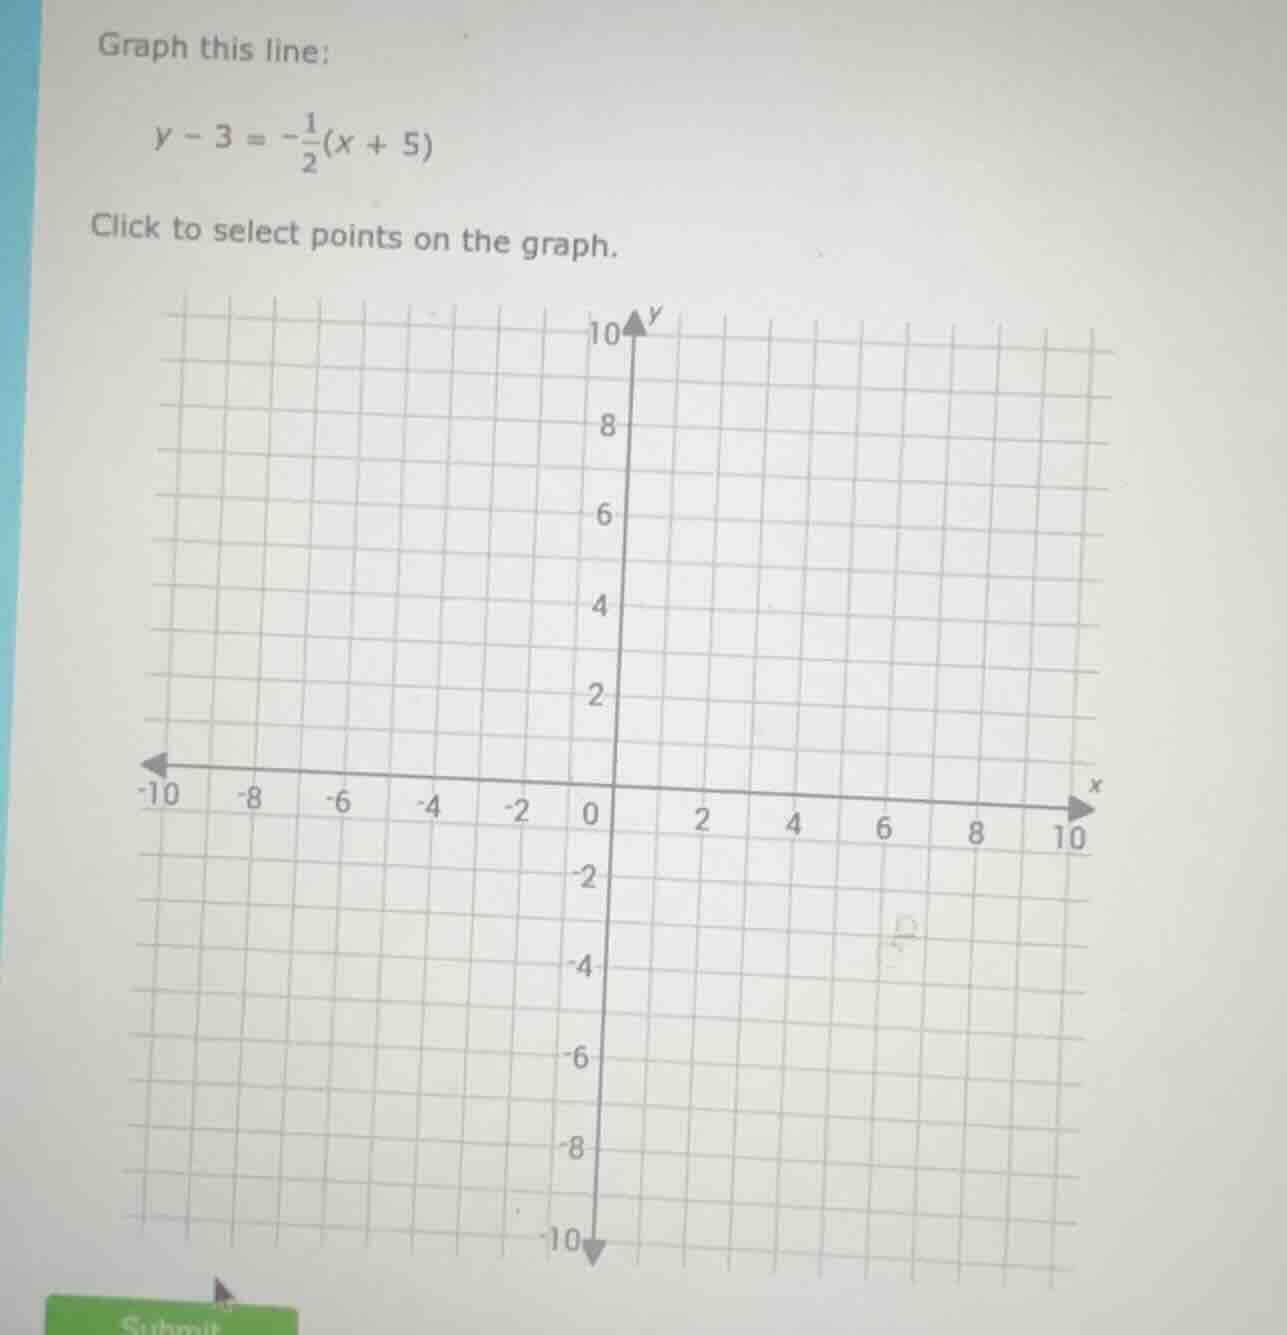
graph this line:
y - 3 = -\frac{1}{2}(x + 5)
click to select points on the graph.
(graph with x-axis from -10 to 10 and y-axis from -10 to 10, grid lines)
Step1: Identify the form of the equation
The given equation \( y - 3 = -\frac{1}{2}(x + 5) \) is in point - slope form \( y - y_1=m(x - x_1) \), where \( (x_1,y_1)=(- 5,3) \) and the slope \( m =-\frac{1}{2}\). So we can start by plotting the point \( (-5,3) \).
Step2: Find another point using the slope
The slope \( m=-\frac{1}{2}=\frac{\text{change in }y}{\text{change in }x} \). From the point \( (-5,3) \), if we increase \( x \) by 2 (since the denominator of the slope is 2), the change in \( y \) will be - 1 (because the numerator is - 1). So the new \( x \) - coordinate is \( - 5+2=-3 \) and the new \( y \) - coordinate is \( 3+( - 1)=2 \). So we have another point \( (-3,2) \). We can also find a point by decreasing \( x \) by 2: \( x=-5 - 2=-7 \), \( y = 3+1 = 4 \), so the point \( (-7,4) \) is also on the line.
Step3: Plot the points and draw the line
Plot the points \( (-5,3) \), \( (-3,2) \), \( (-7,4) \) (or any two of these points) on the coordinate plane and then draw a straight line passing through them.
(Note: Since the problem is about graphing, the key is to identify the points on the line using the point - slope form and the slope to plot the line. The actual graphing is done by marking the points on the given grid and drawing the line through them.)

Snap & solve any problem in the app
Get step-by-step solutions on Sovi AI
Photo-based solutions with guided steps
Explore more problems and detailed explanations
To graph the line \( y - 3=-\frac{1}{2}(x + 5) \):
- Plot the point \( (-5,3) \) (from the point - slope form \( y - y_1=m(x - x_1) \) where \( x_1=-5,y_1 = 3 \)).
- Use the slope \( m =-\frac{1}{2}\) to find another point. For example, from \( (-5,3) \), move 2 units to the right (increase \( x \) by 2) and 1 unit down (decrease \( y \) by 1) to get the point \( (-3,2) \).
- Draw a straight line through the plotted points (e.g., \( (-5,3) \) and \( (-3,2) \)) on the coordinate grid.