QUESTION IMAGE
Question
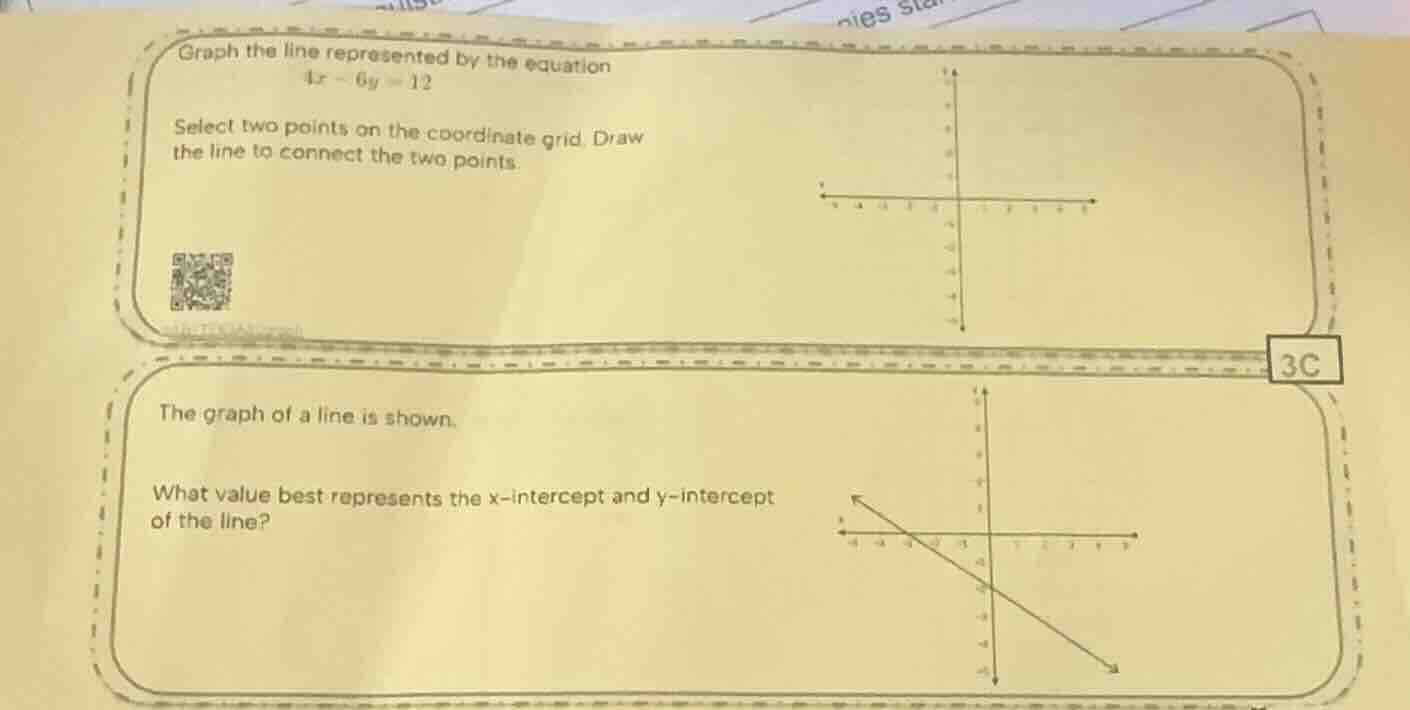
graph the line represented by the equation 4x - 6y = 12
select two points on the coordinate grid. draw
the line to connect the two points.
the graph of a line is shown.
what value best represents the x - intercept and y - intercept
of the line?
First Sub - Question (Graph the line \(4x - 6y=12\))
Step 1: Find the x - intercept
To find the x - intercept, we set \(y = 0\) in the equation \(4x-6y = 12\).
Substituting \(y = 0\) into the equation gives \(4x-6(0)=12\), which simplifies to \(4x=12\).
Dividing both sides by 4, we get \(x=\frac{12}{4}=3\). So the x - intercept is the point \((3,0)\).
Step 2: Find the y - intercept
To find the y - intercept, we set \(x = 0\) in the equation \(4x - 6y=12\).
Substituting \(x = 0\) into the equation gives \(4(0)-6y=12\), which simplifies to \(- 6y=12\).
Dividing both sides by \(-6\), we get \(y=\frac{12}{-6}=- 2\). So the y - intercept is the point \((0, - 2)\).
We can now plot the points \((3,0)\) and \((0,-2)\) on the coordinate grid and draw a line through them.
Second Sub - Question (Find x - intercept and y - intercept from the graph)
Since the graph is not fully visible with exact coordinates, but from the general idea of x - intercept (where the line crosses the x - axis, \(y = 0\)) and y - intercept (where the line crosses the y - axis, \(x=0\)).
Looking at the partial graph, if we assume the line crosses the x - axis at \(x=-3\) (from the grid markings) and the y - axis at \(y = - 2\) (or some similar value based on the grid). But since the graph details are a bit unclear, if we take the first sub - question's equation - related intercepts as a reference (but for the given graph in the second sub - question), we can estimate:
The x - intercept is the x - value when \(y = 0\), and from the graph (assuming the line crosses the x - axis at \(x=-3\)) and the y - intercept is the y - value when \(x = 0\) (assuming \(y=-2\) or a similar value based on the grid).

Snap & solve any problem in the app
Get step-by-step solutions on Sovi AI
Photo-based solutions with guided steps
Explore more problems and detailed explanations
- For the first sub - question: The two points are \((3,0)\) (x - intercept) and \((0,-2)\) (y - intercept). Plot these points and draw the line.
- For the second sub - question: (Estimated from the given graph structure) If the line crosses the x - axis at \(x=-3\) and the y - axis at \(y=-2\) (the actual values depend on the exact graph, but based on the grid and the first sub - question's context, a possible answer is x - intercept \(\approx - 3\) and y - intercept \(\approx - 2\)).