QUESTION IMAGE
Question
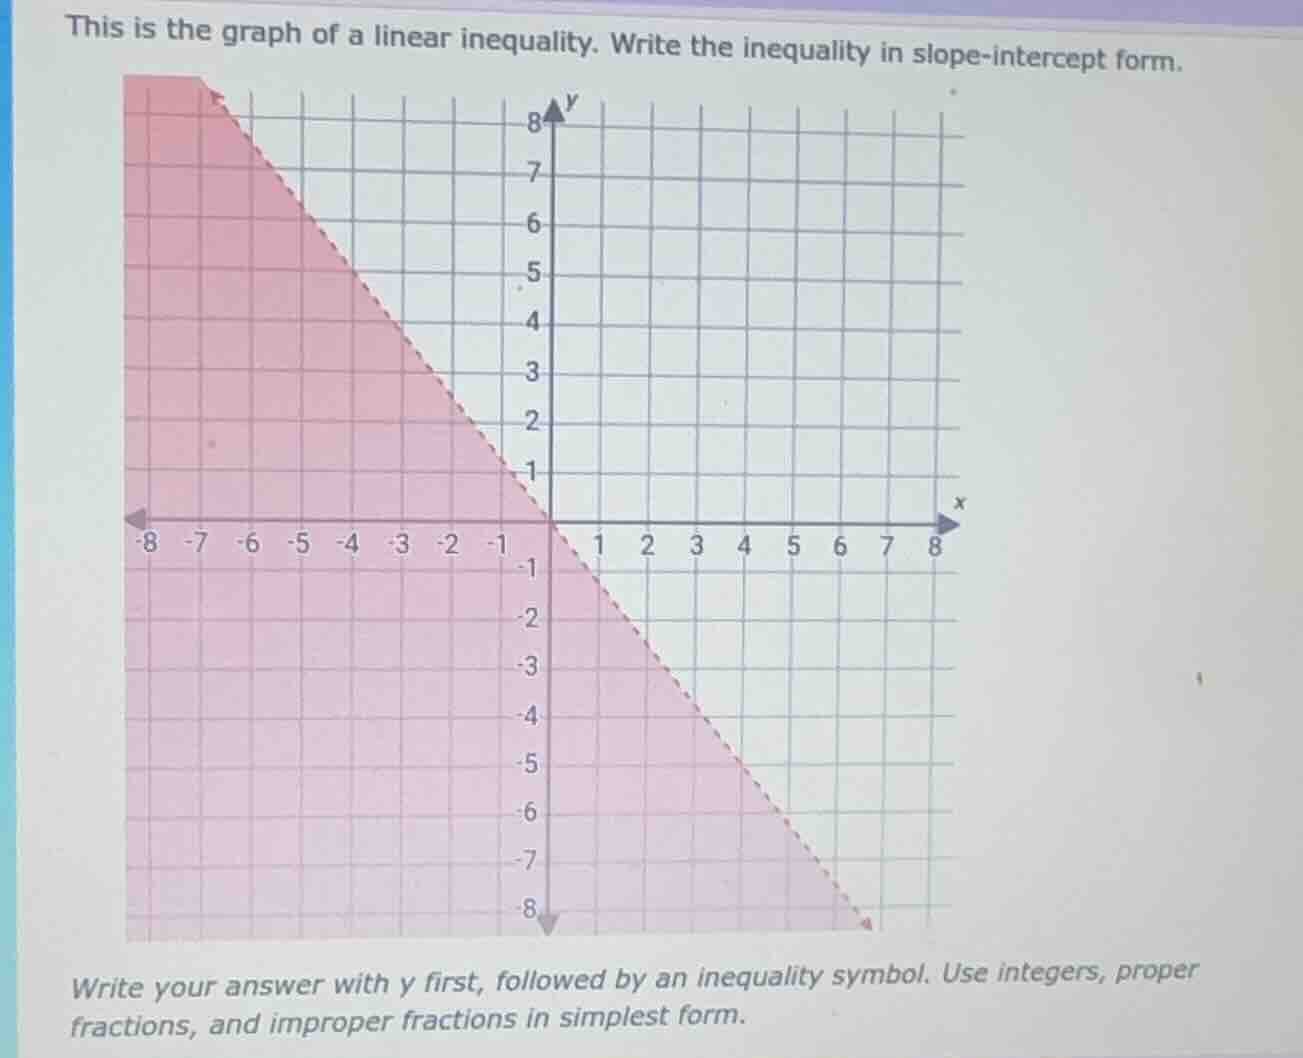
this is the graph of a linear inequality. write the inequality in slope - intercept form.
write your answer with y first, followed by an inequality symbol. use integers, proper fractions, and improper fractions in simplest form.
Step1: Find the slope of the line
The line passes through \((0, 0)\) and \((1, -1)\) (we can also use other points, but these are easy to identify). The slope \(m\) is calculated as \(m=\frac{y_2 - y_1}{x_2 - x_1}\). So \(m=\frac{-1 - 0}{1 - 0}=-1\).
Step2: Determine the equation of the boundary line
The slope - intercept form of a line is \(y = mx + b\). Since the line passes through the origin \((0,0)\), \(b = 0\). So the equation of the boundary line is \(y=-x\) (or \(y=-1x + 0\)).
Step3: Determine the inequality symbol
The line is dashed, so the inequality is either \(y\lt - x\) or \(y\gt - x\). We test a point in the shaded region. Let's take the point \((-1,0)\). Substitute into \(y\) and \(-x\): \(y = 0\), \(-x=-(-1)=1\). Since \(0\lt1\), the shaded region satisfies \(y\lt - x\)? Wait, no, wait. Wait, if we take \((-2,0)\): \(y = 0\), \(-x=-(-2) = 2\), \(0\lt2\). Wait, but let's check the direction of the shading. The shaded region is to the left of the line \(y=-x\). Wait, maybe I made a mistake in the slope. Wait, let's take another pair of points. Let's take \((0,0)\) and \((2,-2)\). Then \(m=\frac{-2 - 0}{2 - 0}=-1\), same slope. Now, let's take a point in the shaded area, say \((-3,0)\). Plug into \(y\) and \(-x\): \(y = 0\), \(-x=-(-3)=3\), \(0\lt3\). Wait, but the line is dashed, and the shading: let's see, when \(x = 0\), the line is \(y = 0\). The shaded region includes the area where, for example, when \(x=-1\), \(y\) can be 0 (which is in the shaded region). Wait, no, maybe I got the slope wrong. Wait, let's look at the graph again. The line goes from the origin down to the right, so for every 1 unit we move to the right (increase \(x\) by 1), we move down 1 unit (decrease \(y\) by 1), so slope is - 1. Now, the shaded region: let's take the point \((0,1)\), is it in the shaded region? No, the shaded region at \(x = 0\) is below \(y = 0\)? Wait, no, the graph shows that at \(x = 0\), the shaded region includes \(y\) values from \(-\infty\) up to... Wait, no, looking at the graph, the shaded area is above or below? Wait, the red shaded area: when \(x=-2\), the \(y\) values are from, say, - 8 up to, like, 6? Wait, maybe I messed up the slope. Wait, let's take two points on the dashed line: \((0,0)\) and \((3,-3)\). So slope \(m=\frac{-3 - 0}{3 - 0}=-1\). Now, the inequality: the line is dashed, so it's a strict inequality. Now, let's test the point \((-1,1)\). Wait, \((-1,1)\): \(y = 1\), \(-x=-(-1)=1\), so \(y=-x\) at that point, but the line is dashed, so that point is not on the line. Wait, maybe the shaded region is \(y\leq - x\)? No, the line is dashed, so it's \(y\lt - x\) or \(y\gt - x\). Wait, let's take the point \((0, - 1)\). \(y=-1\), \(-x = 0\), \(-1\lt0\), and \((0,-1)\) is in the shaded region. Take the point \((0,1)\), \(y = 1\), \(-x=0\), \(1\gt0\), and \((0,1)\) is not in the shaded region. So the inequality is \(y\lt - x\)? Wait, no, wait the slope: maybe I had the slope sign wrong. Wait, if we go from \((0,0)\) to \((-1,1)\), then \(m=\frac{1 - 0}{-1 - 0}=-1\), same as before. Wait, maybe the correct inequality is \(y\leq - x\)? No, the line is dashed, so it's a strict inequality. Wait, maybe I made a mistake in the direction of the shading. Let's look at the graph again. The shaded area is on the left - hand side of the line \(y=-x\). Let's take \(x=-2\), then \(y=-x = 2\). The shaded region at \(x=-2\) includes \(y\) values from, say, - 8 up to 6? Wait, no, the grid: each square is 1 unit. The dashed line goes from the top - left (around \((-6,6)\)) down to the bottom - right (around \((6,…

Snap & solve any problem in the app
Get step-by-step solutions on Sovi AI
Photo-based solutions with guided steps
Explore more problems and detailed explanations
\(y\lt - x\)