QUESTION IMAGE
Question
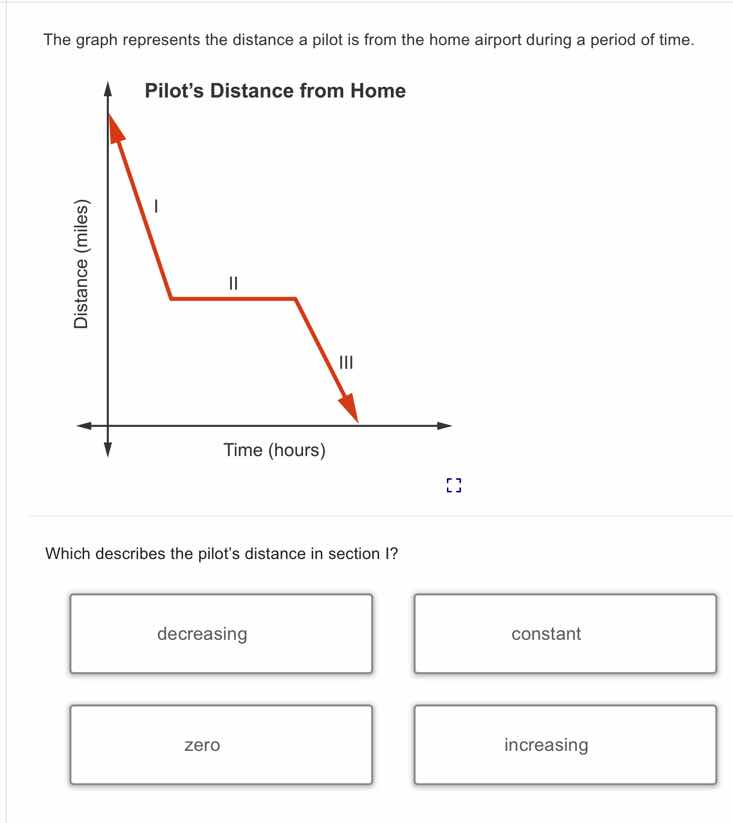
the graph represents the distance a pilot is from the home airport during a period of time.
pilot’s distance from home
distance (miles)
time (hours)
which describes the pilot’s distance in section i?
decreasing
constant
zero
increasing
In a distance - time graph, the slope of the line represents the rate of change of distance with respect to time. For section I of the graph, as time (the x - axis) increases, the distance from the home airport (the y - axis) is getting smaller. When the value of a quantity (distance, in this case) decreases as the independent variable (time) increases, we say that the quantity is decreasing. A "constant" distance would be represented by a horizontal line (slope = 0), "zero" distance would be at the origin or on the x - axis, and "increasing" distance would be represented by a line with a positive slope (distance increases as time increases). So, in section I, the pilot's distance is decreasing.

Snap & solve any problem in the app
Get step-by-step solutions on Sovi AI
Photo-based solutions with guided steps
Explore more problems and detailed explanations
decreasing