QUESTION IMAGE
Question
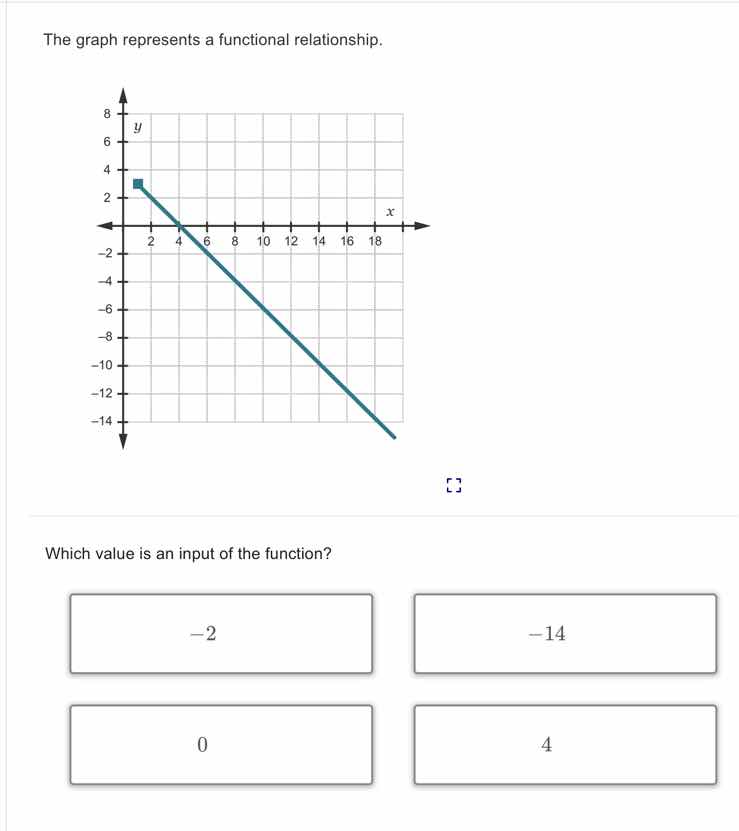
the graph represents a functional relationship.
graph of a line on a coordinate plane with x-axis from -2 to 18 and y-axis from -14 to 8, passing through (1, 3) and (4, -1) etc., and a blue dot at (1, 3)
which value is an input of the function?
-2 -14
0 4
Step1: Understand input of a function
In a function, the input is the \( x \)-value (independent variable), and the output is the \( y \)-value (dependent variable). So we need to check which of the given values is an \( x \)-value on the graph.
Step2: Analyze the graph
Looking at the graph, the line passes through points. Let's check the \( x \)-coordinates (inputs) of the points on the line. The given options are \( -2 \), \( -14 \), \( 0 \), \( 4 \).
- \( -2 \): Is this an \( x \)-value on the graph? The graph's \( x \)-axis starts from 0 (leftmost visible \( x \) is around 0? Wait, the blue dot is at \( (1, 3) \)? Wait no, looking at the grid: the blue dot is at \( x = 1 \)? Wait no, the first grid line on \( x \) is 2? Wait, the \( x \)-axis has marks at 2, 4, 6, etc. Wait, the blue dot is at \( x = 1 \)? No, maybe the first \( x \)-coordinate is 1? Wait, no, let's check the options. The option 4: does the line pass through \( x = 4 \)? Let's see, when \( x = 4 \), what's the \( y \)-value? The line is decreasing. Let's check the \( x \)-values (inputs) that are on the graph.
Wait, the input is the \( x \)-value. So we need to see which of the options is an \( x \)-value (input) for the function. Let's check each option:
- \( -2 \): Is there a point on the graph with \( x = -2 \)? The graph starts at \( x \) around 1 (the blue dot) and goes to the right. So \( x = -2 \) is not an input (since the graph's \( x \)-values start from around 1 or 2? Wait, no, the blue dot is at \( x = 1 \)? Wait, the grid: each square is 1 unit? Let's see, the \( x \)-axis: the first mark after 0 is 2? No, maybe each grid square is 1 unit. So the blue dot is at \( (1, 3) \)? Wait, no, the \( y \)-axis: the blue dot is at \( y = 3 \), \( x = 1 \)? Wait, maybe I misread. Wait, the options are \( -2 \), \( -14 \), \( 0 \), \( 4 \).
Wait, \( -14 \) is a \( y \)-value (output), because it's on the \( y \)-axis (output is \( y \)). So \( -14 \) is an output, not input.
\( -2 \): Is this an \( x \)-value? The graph's \( x \)-values (inputs) are positive? Wait, no, the \( x \)-axis goes to the left (negative) and right (positive). But the graph shown has the line starting from the blue dot (which is at \( x = 1 \), \( y = 3 \)) and going down to the right. Wait, maybe the blue dot is at \( (1, 3) \)? No, maybe the first \( x \)-coordinate is 1, but the options include 4. Let's check \( x = 4 \). When \( x = 4 \), what's the \( y \)-value? The line passes through \( x = 4 \)? Let's see, the line goes through \( x = 4 \) (since the \( x \)-axis has a mark at 4, and the line crosses \( x = 4 \)). So \( x = 4 \) is an input (since input is \( x \)-value).
Let's confirm:
- \( -2 \): Not an \( x \)-value on the graph (the graph's \( x \)-values start from around 1, and the line is moving to the right, so \( x = -2 \) is not on the line).
- \( -14 \): This is a \( y \)-value (output), so it's not an input.
- \( 0 \): Is there a point with \( x = 0 \) on the graph? The blue dot is at \( x = 1 \), so \( x = 0 \) is not on the line.
- \( 4 \): The line passes through \( x = 4 \) (since the line is drawn through \( x = 4 \) on the \( x \)-axis), so \( x = 4 \) is an input ( \( x \)-value) of the function.

Snap & solve any problem in the app
Get step-by-step solutions on Sovi AI
Photo-based solutions with guided steps
Explore more problems and detailed explanations
4 (the option with value 4, i.e., the last option: 4)