QUESTION IMAGE
Question
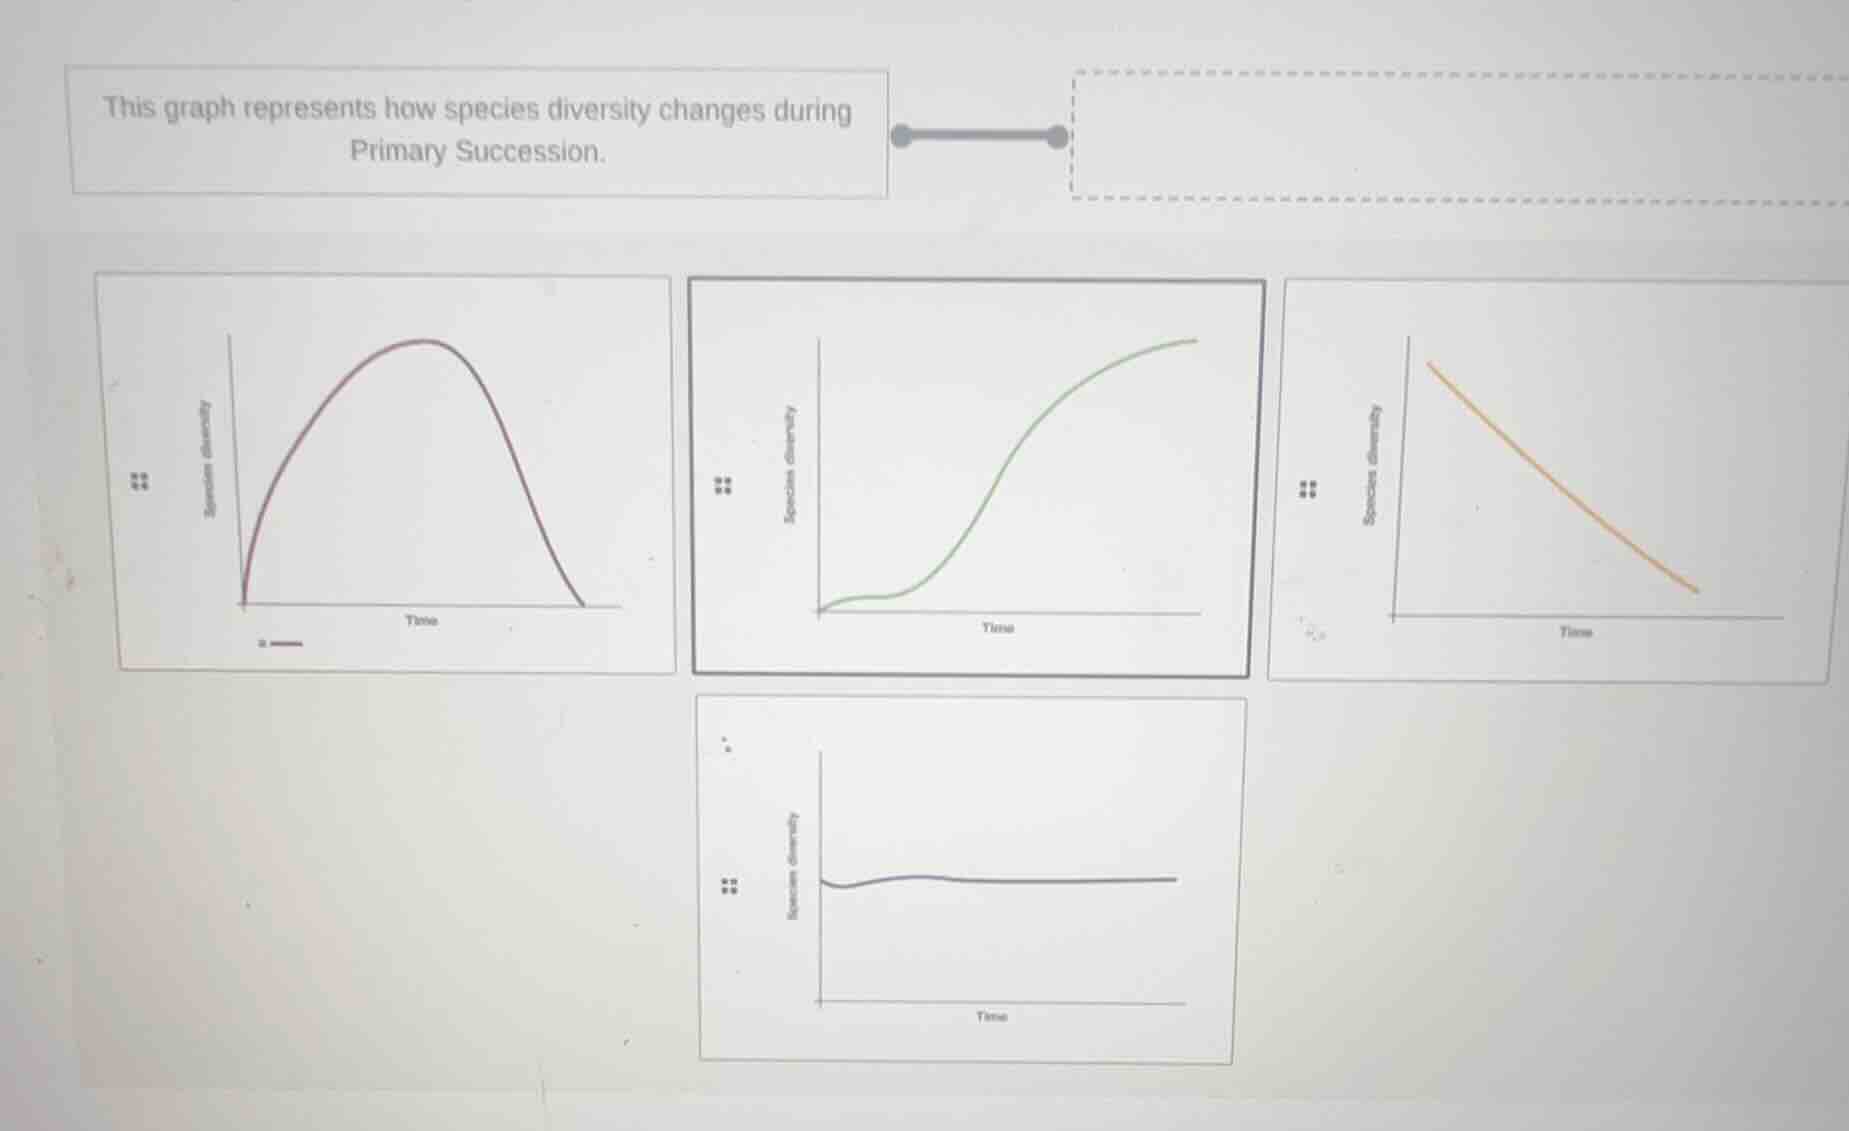
this graph represents how species diversity changes during primary succession.
Brief Explanations
Primary succession starts in an area with no existing life/soil. Over time, pioneer species colonize, then more species establish, increasing diversity. As the ecosystem matures, diversity rises and eventually levels off (reaches a stable climax community) rather than decreasing or spiking then falling.

Snap & solve any problem in the app
Get step-by-step solutions on Sovi AI
Photo-based solutions with guided steps
Explore more problems and detailed explanations
The top-middle graph (S-shaped curve increasing then leveling off)