QUESTION IMAGE
Question
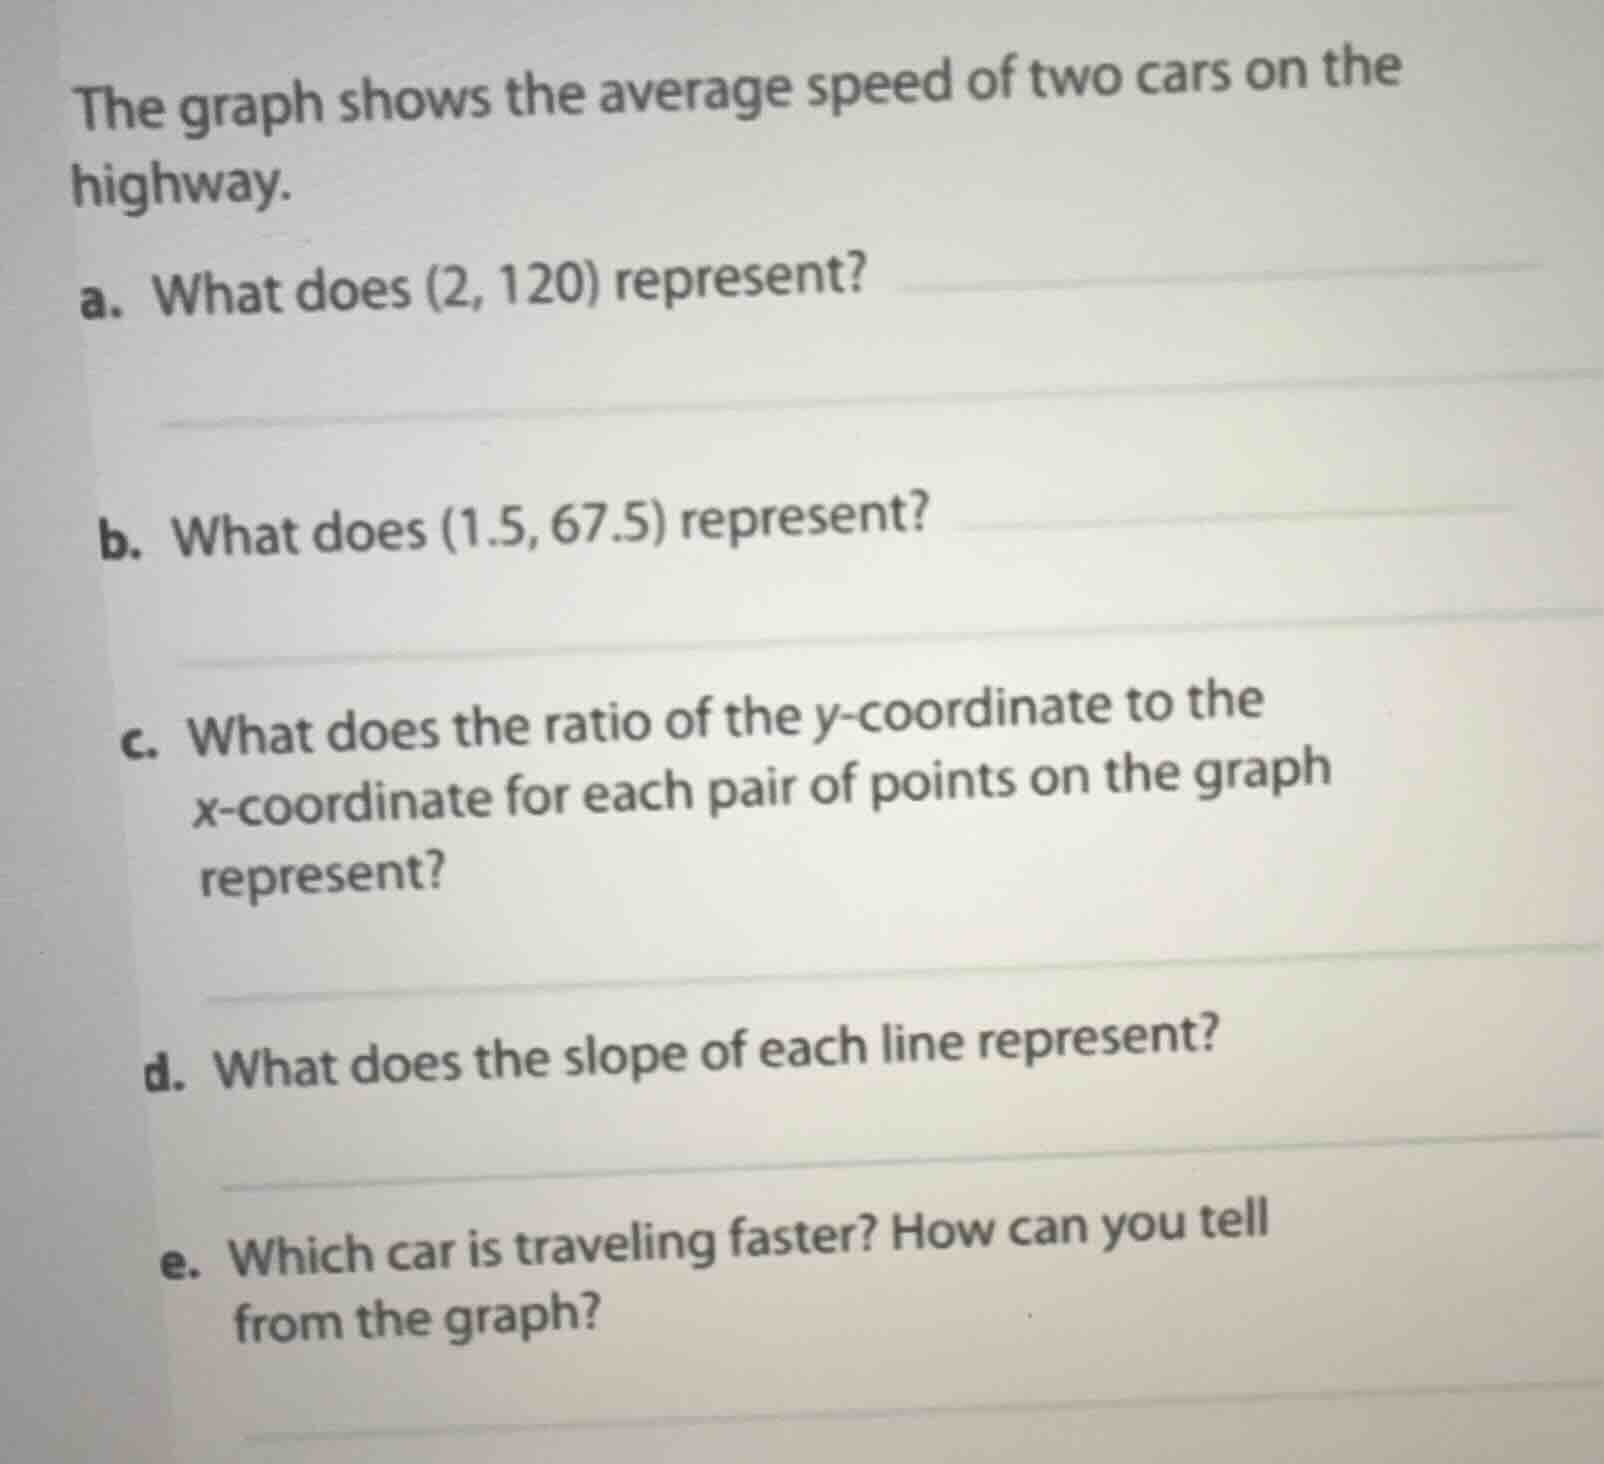
the graph shows the average speed of two cars on the highway.
a. what does (2, 120) represent?
b. what does (1.5, 67.5) represent?
c. what does the ratio of the y-coordinate to the x-coordinate for each pair of points on the graph represent?
d. what does the slope of each line represent?
e. which car is traveling faster? how can you tell from the graph?
a. In distance-time graphs for speed, the x-coordinate is time (hours) and y is distance (miles). (2,120) links time to total distance traveled.
b. Using the same x=time, y=distance logic, (1.5,67.5) maps time to distance for the second car.
c. The ratio $\frac{y}{x}$ is $\frac{\text{distance}}{\text{time}}$, which is the definition of average speed.
d. Slope of a line is $\frac{\Delta y}{\Delta x} = \frac{\text{change in distance}}{\text{change in time}}$, matching average speed.
e. Faster cars have steeper slopes (higher speed = more distance per time), so the line with greater slope is faster.

Snap & solve any problem in the app
Get step-by-step solutions on Sovi AI
Photo-based solutions with guided steps
Explore more problems and detailed explanations
a. After 2 hours, one car has traveled 120 miles.
b. After 1.5 hours, the other car has traveled 67.5 miles.
c. The ratio represents the average speed of the corresponding car (in miles per hour).
d. The slope of each line represents the constant average speed of each car (in miles per hour).
e. The car corresponding to the line passing through (2, 120) is traveling faster. You can tell because its slope (average speed, $\frac{120}{2}=60$ mph) is steeper than the slope of the other line ($\frac{67.5}{1.5}=45$ mph), meaning it covers more distance per hour.