QUESTION IMAGE
Question
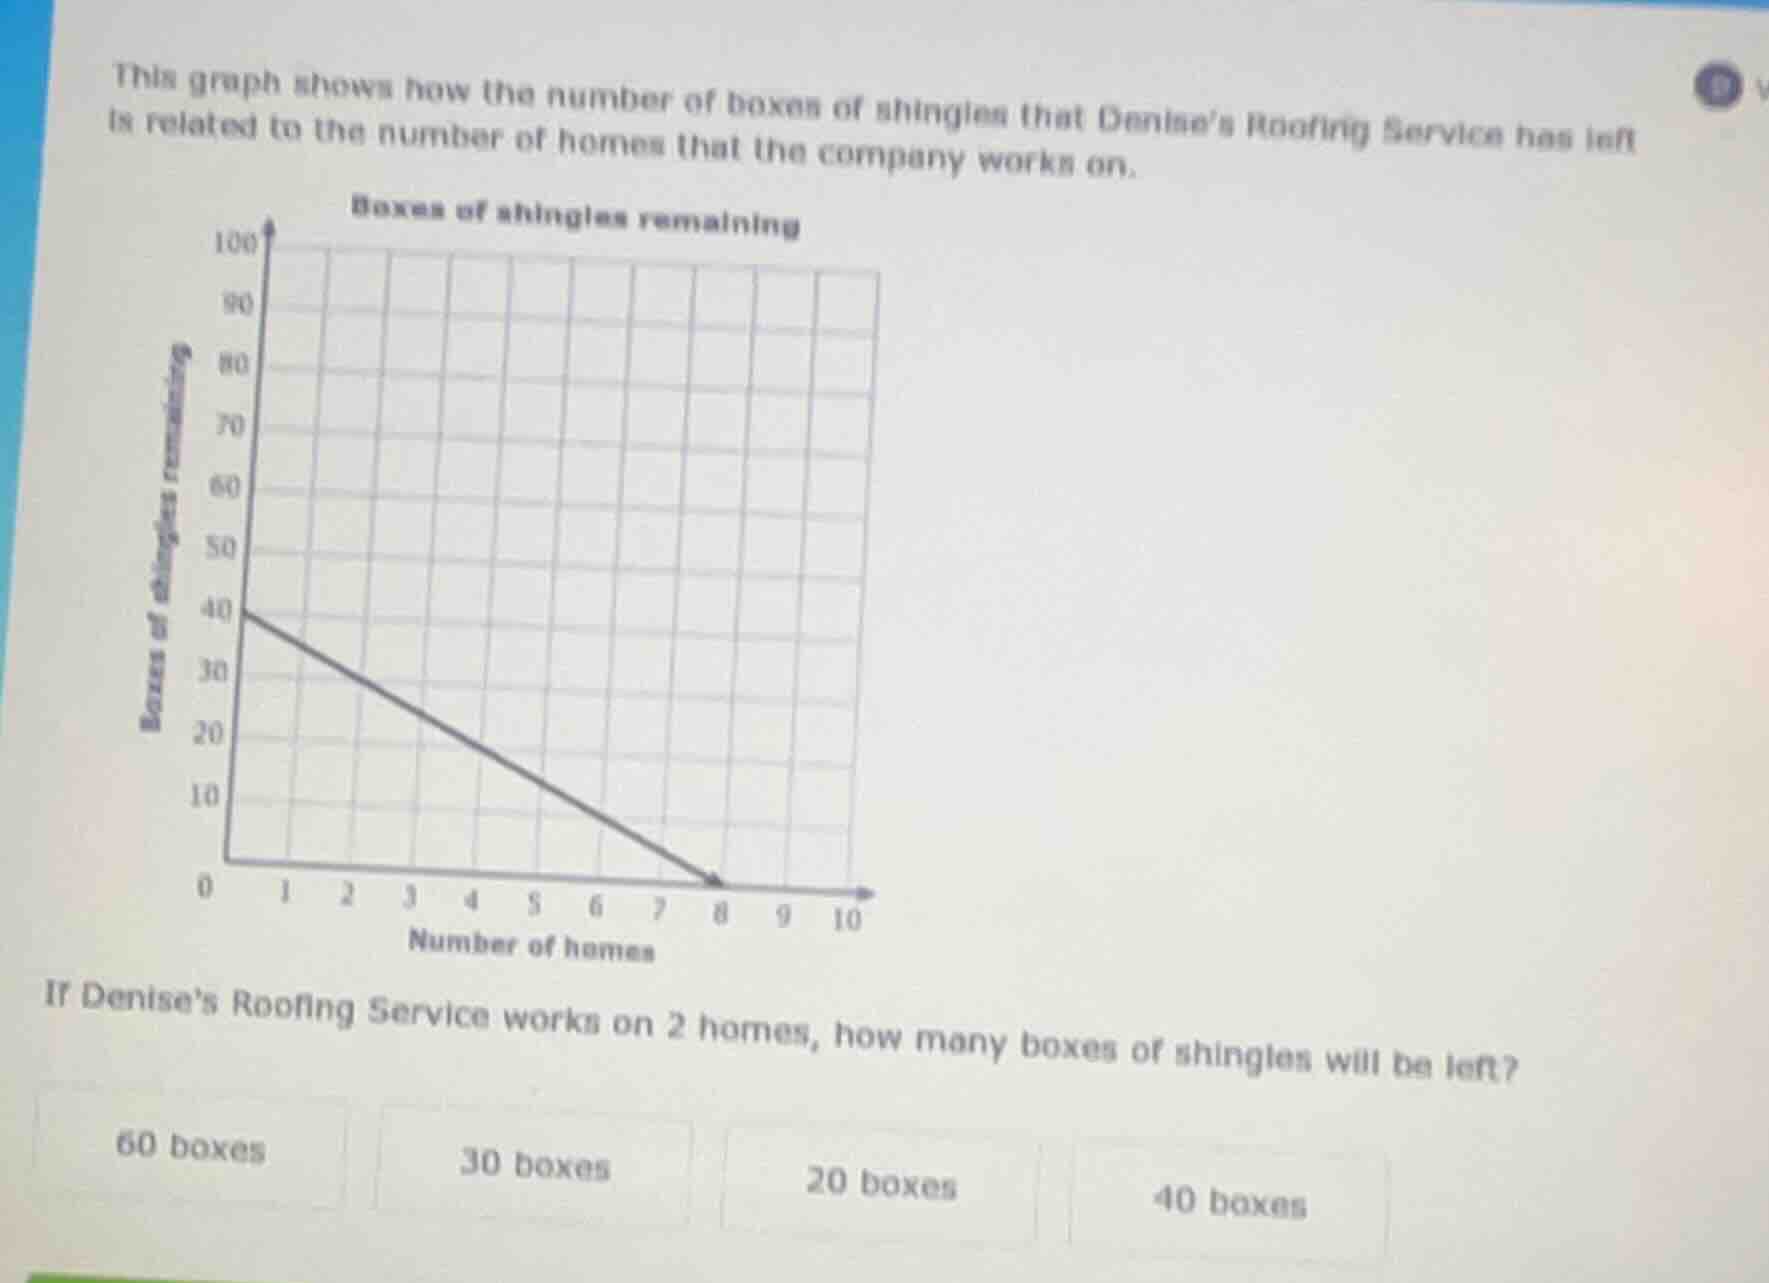
this graph shows how the number of boxes of shingles that denise’s roofing service has left is related to the number of homes that the company works on.
if denise’s roofing service works on 2 homes, how many boxes of shingles will be left?
60 boxes 30 boxes 20 boxes 40 boxes
Step1: Analyze the graph
The graph is a line graph where the x - axis represents the number of homes and the y - axis represents the number of boxes of shingles remaining. We need to find the value of y (boxes of shingles remaining) when x (number of homes) is 2.
Step2: Locate x = 2 on the graph
Looking at the x - axis, when x = 2, we move up to the line and then left to the y - axis. From the graph, when the number of homes is 2, the number of boxes of shingles remaining is 30? Wait, no, let's re - check. Wait, the y - intercept is 40 (when x = 0, y = 40). The line goes from (0, 40) to (8, 0). The slope of the line is $m=\frac{0 - 40}{8-0}=\frac{- 40}{8}=- 5$. So the equation of the line is $y-40=-5(x - 0)$, so $y=-5x + 40$. When x = 2, $y=-5\times2+40=-10 + 40 = 30$? Wait, no, wait the graph: when x = 0, y = 40; x = 1, y = 35? Wait, no, looking at the grid, each square is 10 units on y - axis and 1 unit on x - axis. Wait, when x = 0, y = 40; x = 2, let's see the line. From (0,40) to (8,0), so for x = 2, the y - value: the difference between x = 0 and x = 8 is 8 units of x, and 40 units of y. So per x unit, the decrease in y is $\frac{40}{8}=5$. So when x = 1, y = 40 - 5=35; x = 2, y = 35 - 5 = 30? Wait, but the options have 30 as an option. Wait, no, maybe I misread the graph. Wait, the y - axis is labeled "Boxes of shingles remaining" with ticks at 0,10,20,30,40,50,60,70,80,90,100. The x - axis is "Number of homes" with ticks at 0,1,2,3,4,5,6,7,8,9,10. The line starts at (0,40) and goes to (8,0). So when x = 2, we can see from the graph that the point on the line at x = 2 corresponds to y = 30? Wait, no, wait the user's graph: let's look at the options. The options are 60,30,20,40. Wait, maybe I made a mistake. Wait, when x = 0, y = 40; x = 4, y = 20; x = 8, y = 0. So the equation is y = 40-5x. When x = 2, y = 40 - 10 = 30. Wait, but let's check the graph again. If we look at the grid, when x = 2, the y - coordinate is 30? Wait, no, maybe the graph is such that when x = 2, the y is 30? Wait, the options include 30. Wait, but let's re - examine the graph. The line goes from (0,40) to (8,0). So for x = 2, the y - value is 30. So the number of boxes of shingles left when working on 2 homes is 30? Wait, no, wait the user's graph: maybe I misread. Wait, the y - axis: 40 at x = 0, then at x = 2, the line is at 30? Wait, the options have 30 as an option. So the answer should be 30. Wait, no, wait the graph: let's count the grid. From (0,40) to (8,0), so each x - unit (home) reduces the shingles by 5 boxes. So x = 0: 40, x = 1: 35, x = 2: 30, x = 3: 25, x = 4: 20, x = 8: 0. So when x = 2, y = 30.

Snap & solve any problem in the app
Get step-by-step solutions on Sovi AI
Photo-based solutions with guided steps
Explore more problems and detailed explanations
30 boxes