QUESTION IMAGE
Question
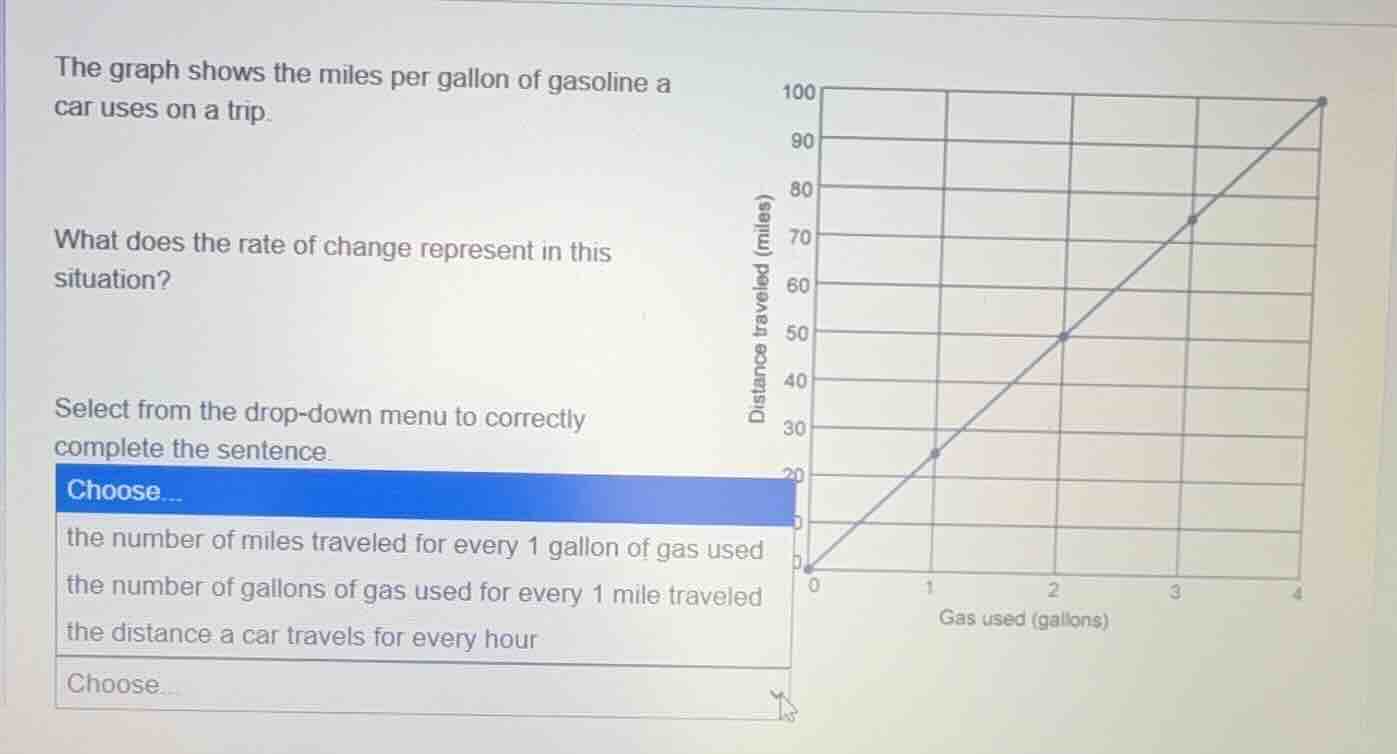
the graph shows the miles per gallon of gasoline a car uses on a trip.
what does the rate of change represent in this situation?
select from the drop - down menu to correctly complete the sentence.
choose...
the number of miles traveled for every 1 gallon of gas used
the number of gallons of gas used for every 1 mile traveled
the distance a car travels for every hour
choose...
graph: x - axis labeled gas used (gallons) with values 0, 1, 2, 3, 4; y - axis labeled distance traveled (miles) with values 0, 20, 30, 40, 50, 60, 70, 80, 90, 100; a line passing through (0,0), (1,25), (2,50), (3,75), (4,100)
The graph has distance traveled (miles) on the y-axis and gas used (gallons) on the x-axis. The rate of change is calculated as $\frac{\text{change in miles}}{\text{change in gallons}}$, which represents miles per gallon, meaning the miles traveled per 1 gallon of gas used. The other options do not match: the second option would be gallons per mile (inverse rate), and the third involves time (hours), which is not present in the graph.

Snap & solve any problem in the app
Get step-by-step solutions on Sovi AI
Photo-based solutions with guided steps
Explore more problems and detailed explanations
the number of miles traveled for every 1 gallon of gas used