QUESTION IMAGE
Question
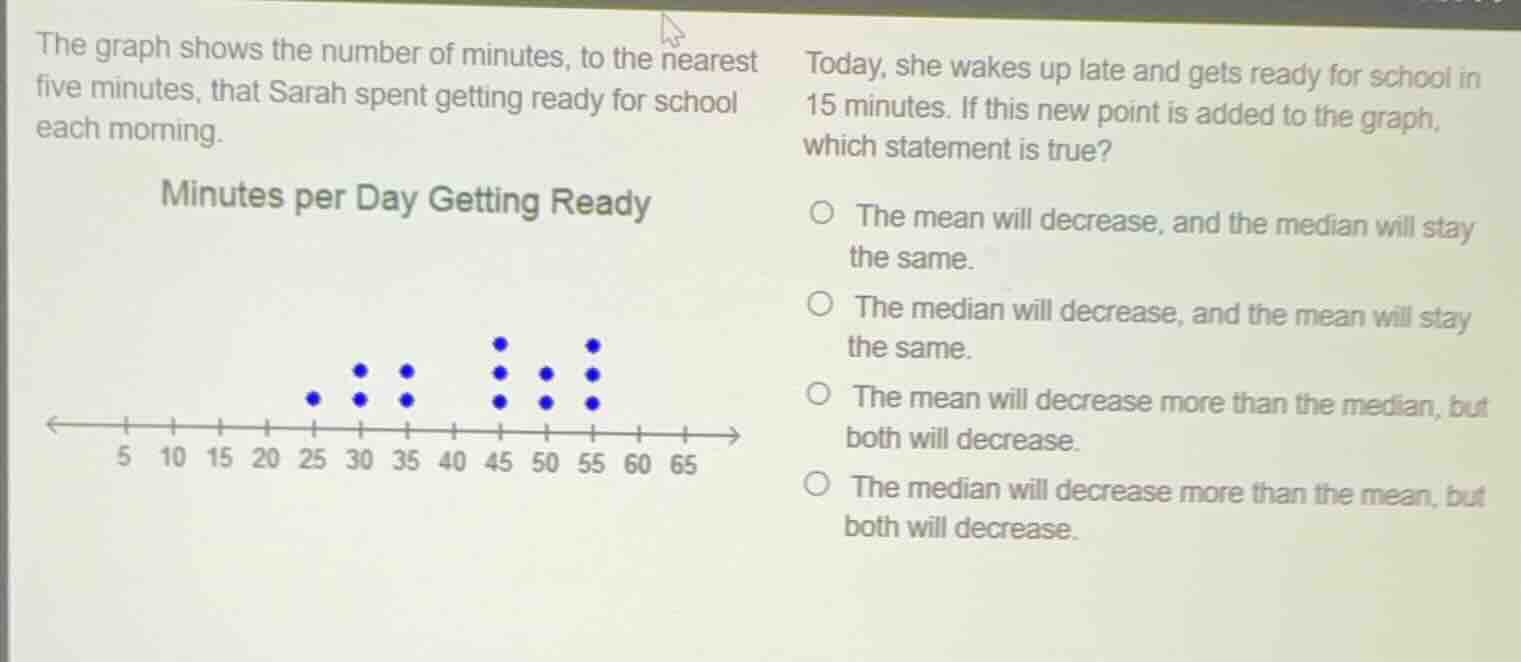
the graph shows the number of minutes, to the nearest five minutes, that sarah spent getting ready for school each morning.
minutes per day getting ready
5 10 15 20 25 30 35 40 45 50 55 60 65
today, she wakes up late and gets ready for school in 15 minutes. if this new point is added to the graph, which statement is true?
the mean will decrease, and the median will stay the same.
the median will decrease, and the mean will stay the same.
the mean will decrease more than the median, but both will decrease.
the median will decrease more than the mean, but both will decrease.
Step1: Count original data points
First, count the number of data points from the dot plot. Let's list the number of dots at each minute:
- 25: 1 dot
- 30: 2 dots
- 35: 2 dots
- 45: 3 dots
- 50: 2 dots
- 55: 3 dots
Total original data points: \(1 + 2 + 2 + 3 + 2 + 3 = 13\) points.
Step2: Find original median
For 13 data points, the median is the 7th value (since \(\frac{13 + 1}{2}=7\)). Let's order the data:
- 25 (1), 30 (2), 30 (3), 35 (4), 35 (5), 45 (6), 45 (7), 45 (8), 50 (9), 50 (10), 55 (11), 55 (12), 55 (13)
So original median is 45.
Step3: Find new data set
Now, add the new data point (15 minutes). So new number of data points is \(13 + 1 = 14\).
Step4: Find new median
For 14 data points, the median is the average of the 7th and 8th values. Let's order the new data:
- 15 (1), 25 (2), 30 (3), 30 (4), 35 (5), 35 (6), 45 (7), 45 (8), 45 (9), 50 (10), 50 (11), 55 (12), 55 (13), 55 (14)
Median is \(\frac{45 + 45}{2}=45\)? Wait, no, wait. Wait, original data: let's re - check the dot plot. Wait, the x - axis is 5,10,15,20,25,30,35,40,45,50,55,60,65. The dots: at 25:1, 30:2, 35:2, 45:3, 50:2, 55:3. So original data values: 25, 30,30, 35,35, 45,45,45, 50,50, 55,55,55. Now add 15. So new data: 15,25,30,30,35,35,45,45,45,50,50,55,55,55. Now, the 7th value is 45, 8th value is 45. So median is 45? Wait, that can't be. Wait, maybe I miscounted the original number of points. Wait, 1 (25) + 2 (30) + 2 (35) + 3 (45) + 2 (50) + 3 (55)=1+2 = 3; 3+2 = 5; 5+3 = 8; 8+2 = 10; 10+3 = 13. Yes, 13 points. After adding 15, 14 points. The ordered data: 15,25,30,30,35,35,45,45,45,50,50,55,55,55. So 7th term: 45, 8th term:45. So median is 45, same as before? Wait, no, wait, original median was 45 (13th term, 7th value). Now, with 14 terms, median is average of 7th and 8th. But both 7th and 8th are 45, so median is 45. Wait, but that's the same? Wait, maybe I made a mistake in the original data. Wait, maybe the original data points: let's count the dots again. At 25:1, 30:2, 35:2, 45:3, 50:2, 55:3. So 1+2+2+3+2+3 = 13. Now add 15, so 14 data points. Now, when we order them, the first data point is 15, then 25, then two 30s, two 35s, then three 45s, etc. So the 7th data point: let's list the positions:
1:15
2:25
3:30
4:30
5:35
6:35
7:45
8:45
So median is (45 + 45)/2 = 45. So median stays the same.
Step5: Analyze the mean
The mean is the sum of all data points divided by the number of data points. The original sum: let's calculate original sum.
Original data:
25: 25×1 = 25
30: 30×2 = 60
35: 35×2 = 70
45: 45×3 = 135
50: 50×2 = 100
55: 55×3 = 165
Original sum \(S_{original}=25 + 60+70 + 135+100 + 165=555\)
New sum \(S_{new}=555+15 = 570\)
Original number of data points \(n_{original}=13\), new \(n_{new}=14\)
Original mean \(\bar{x}_{original}=\frac{555}{13}\approx42.69\) (Wait, no, wait, that can't be. Wait, I think I messed up the data values. Wait, the x - axis: the first dot is at 25, so the time values are 25,30,35,45,50,55. So original data:
25 (1), 30 (2), 35 (2), 45 (3), 50 (2), 55 (3). So sum:
25×1 = 25
30×2 = 60
35×2 = 70
45×3 = 135
50×2 = 100
55×3 = 165
Sum: 25+60 = 85; 85+70 = 155; 155+135 = 290; 290+100 = 390; 390+165 = 555. Original mean: 555/13≈42.69. Now, new data: add 15. New sum: 555 + 15=570. New mean: 570/14≈40.71. So the mean decreases from approximately 42.69 to 40.71, and the median was 45 (for 13 data points, the 7th value: let's list the original data in order:
25,30,30,35,35,45,45,45,50,50,55,55,55. The 7th value is 45. After adding 15, the new data in order:15,25,30,30,35,35,45,45,45,5…

Snap & solve any problem in the app
Get step-by-step solutions on Sovi AI
Photo-based solutions with guided steps
Explore more problems and detailed explanations
The mean will decrease, and the median will stay the same.