QUESTION IMAGE
Question
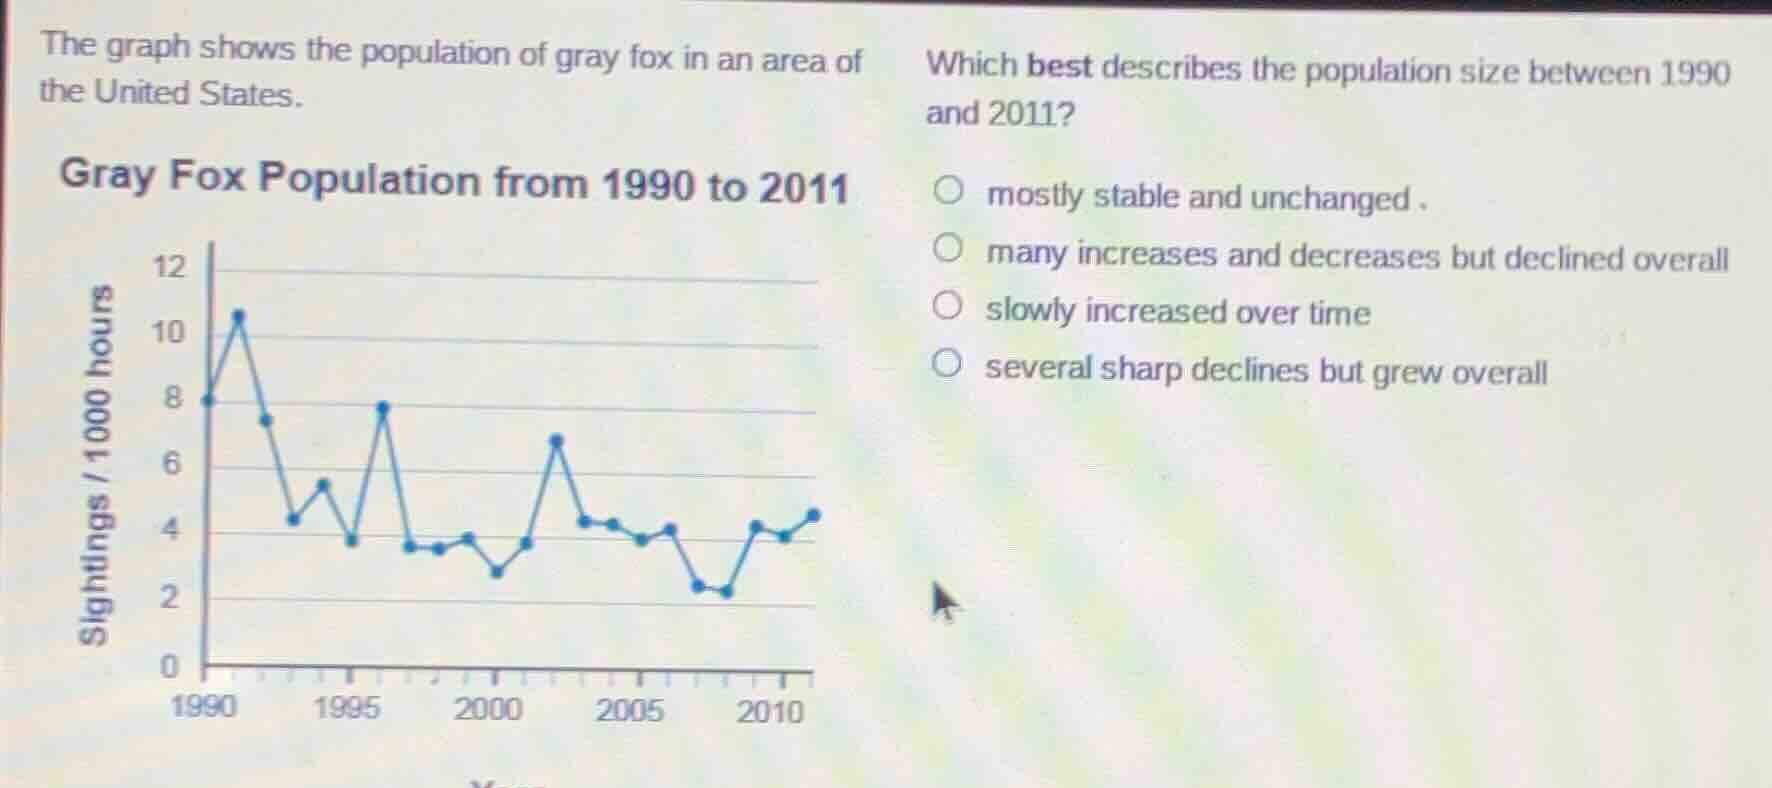
the graph shows the population of gray fox in an area of the united states. gray fox population from 1990 to 2011 which best describes the population size between 1990 and 2011? mostly stable and unchanged. many increases and decreases but declined overall slowly increased over time several sharp declines but grew overall
First, observe the starting point (1990: 8 sightings/1000 hours) and ending point (2011: ~4.5 sightings/1000 hours) of the graph. The line shows repeated peaks and drops (fluctuations) over the period, while the overall trend is a decrease from the initial value to the final value.

Snap & solve any problem in the app
Get step-by-step solutions on Sovi AI
Photo-based solutions with guided steps
Explore more problems and detailed explanations
many increases and decreases but declined overall