QUESTION IMAGE
Question
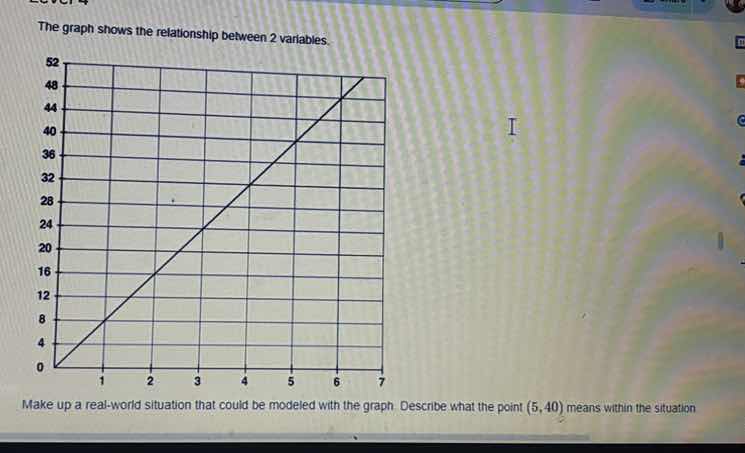
the graph shows the relationship between 2 variables.
make up a real - world situation that could be modeled with the graph. describe what the point (5, 40) means within the situation
First, create a real-world scenario where two quantities have a proportional linear relationship starting at (0,0). Then, define what the x and y variables represent, and explain the meaning of the point (5,40) in that context.

Snap & solve any problem in the app
Get step-by-step solutions on Sovi AI
Photo-based solutions with guided steps
Explore more problems and detailed explanations
Real-world situation: This graph models the total cost (in dollars) of buying packs of coffee, where the x-axis is the number of coffee packs, and the y-axis is the total cost in dollars. Each pack of coffee costs $8.
The point (5,40) means that buying 5 packs of coffee has a total cost of $40.