QUESTION IMAGE
Question
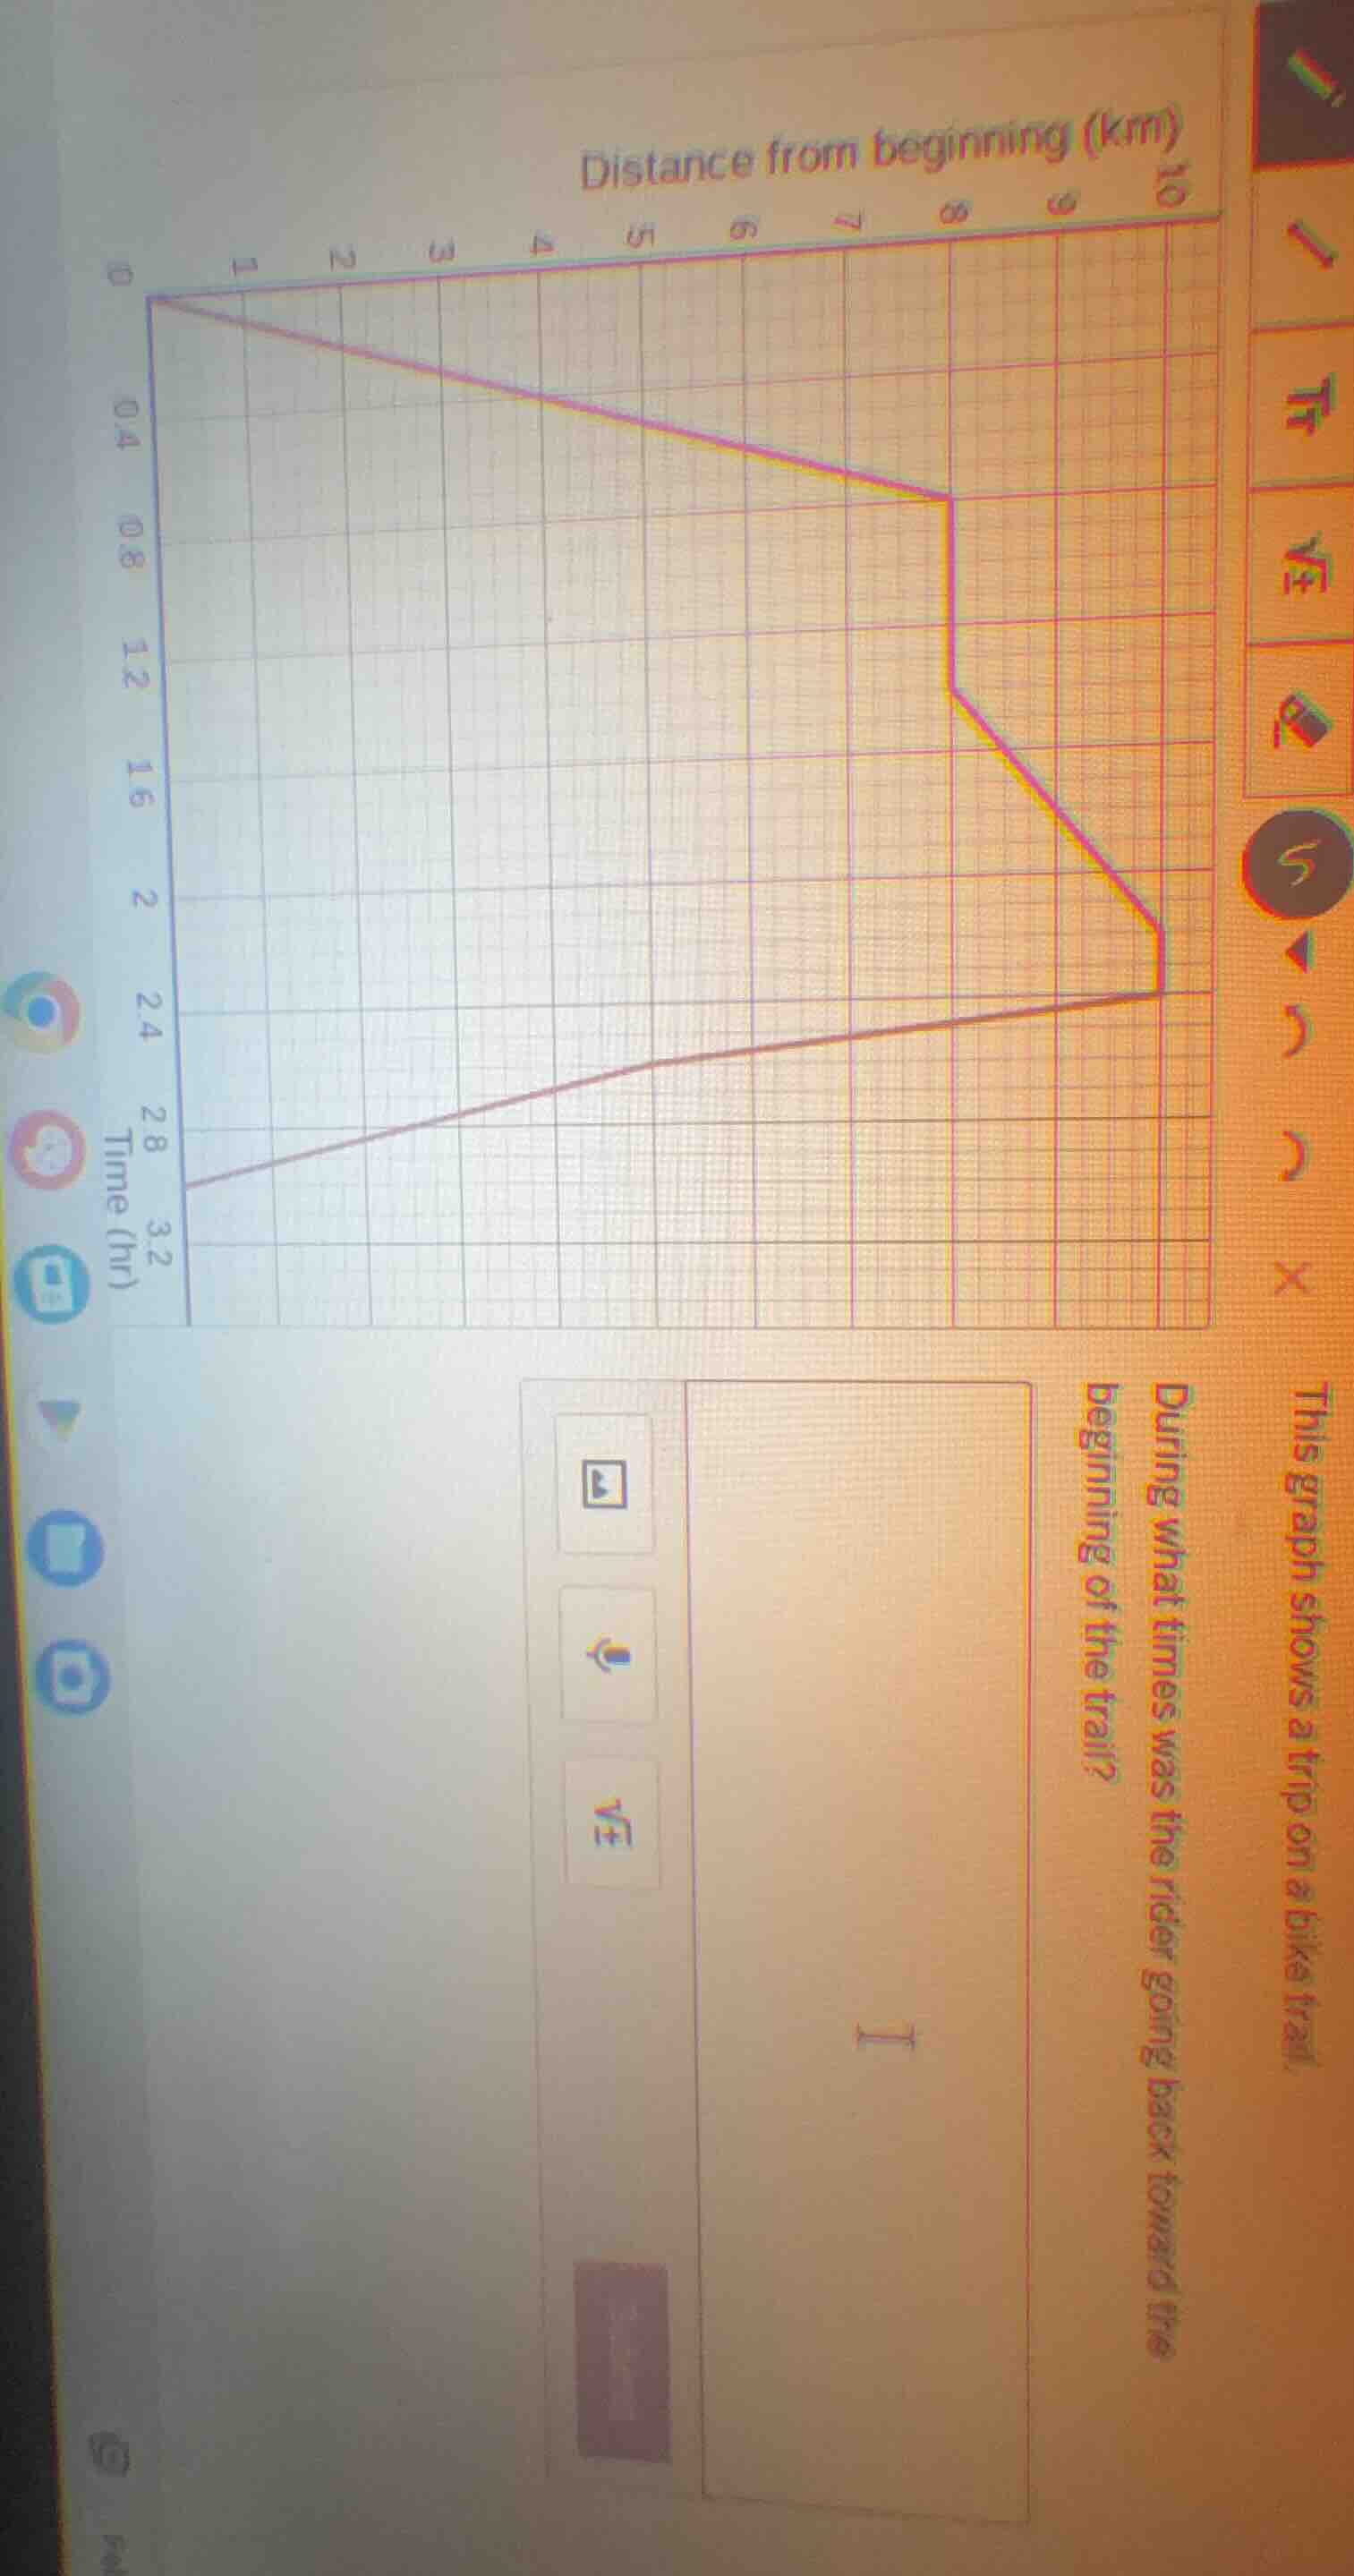
this graph shows a trip on a bike trail. during what times was the rider going back toward the beginning of the trail?
Brief Explanations
On a distance-time graph, moving back toward the start means distance from the beginning decreases as time increases (a downward-sloping line). Looking at the graph, this occurs between 1.0 hour and 2.4 hours, where the distance falls from 8 km toward 0 km.

Snap & solve any problem in the app
Get step-by-step solutions on Sovi AI
Photo-based solutions with guided steps
Explore more problems and detailed explanations
The rider was going back toward the beginning of the trail between 1.0 hour and 2.4 hours.