QUESTION IMAGE
Question
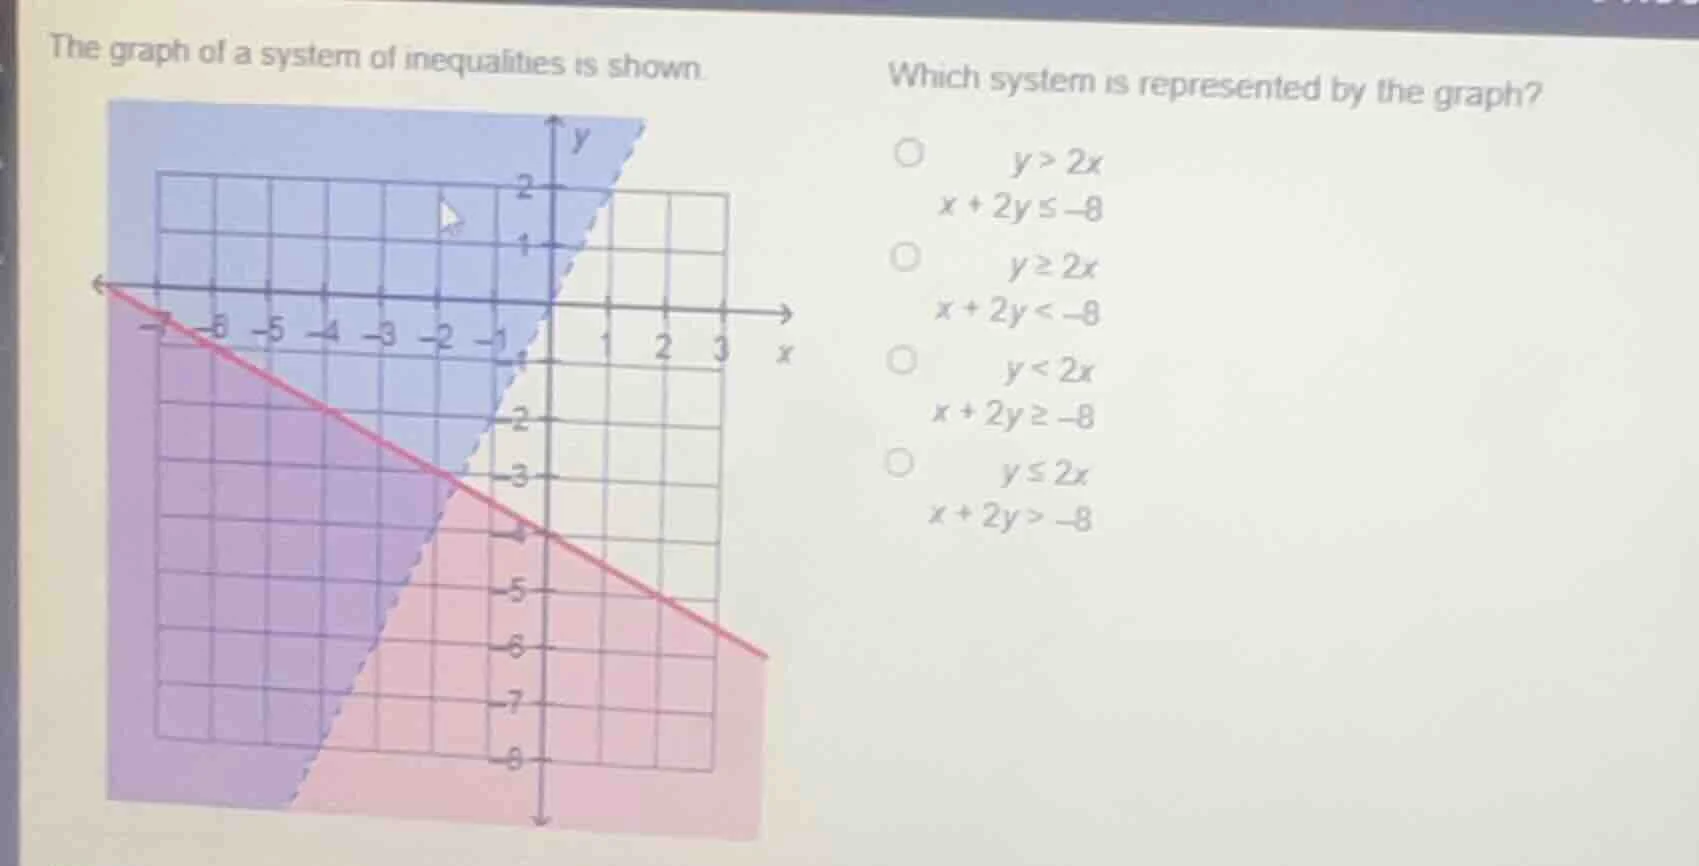
the graph of a system of inequalities is shown. which system is represented by the graph? $\bigcirc$ $y > 2x$ $x + 2y \leq -8$ $\bigcirc$ $y \geq 2x$ $x + 2y < -8$ $\bigcirc$ $y < 2x$ $x + 2y \geq -8$ $\bigcirc$ $y \leq 2x$ $x + 2y > -8$
Step1: Analyze dashed line $y=2x$
The shaded region is above the dashed line $y=2x$, so the inequality is $y > 2x$.
Step2: Analyze solid line $x+2y=-8$
Rewrite to slope-intercept form: $2y = -x -8 \implies y = -\frac{1}{2}x -4$. The shaded region is below this solid line, so the inequality is $x + 2y \leq -8$.
Step3: Match to options
The system $y > 2x$ and $x + 2y \leq -8$ matches the first option.

Snap & solve any problem in the app
Get step-by-step solutions on Sovi AI
Photo-based solutions with guided steps
Explore more problems and detailed explanations
$y > 2x$
$x + 2y \leq -8$