QUESTION IMAGE
Question
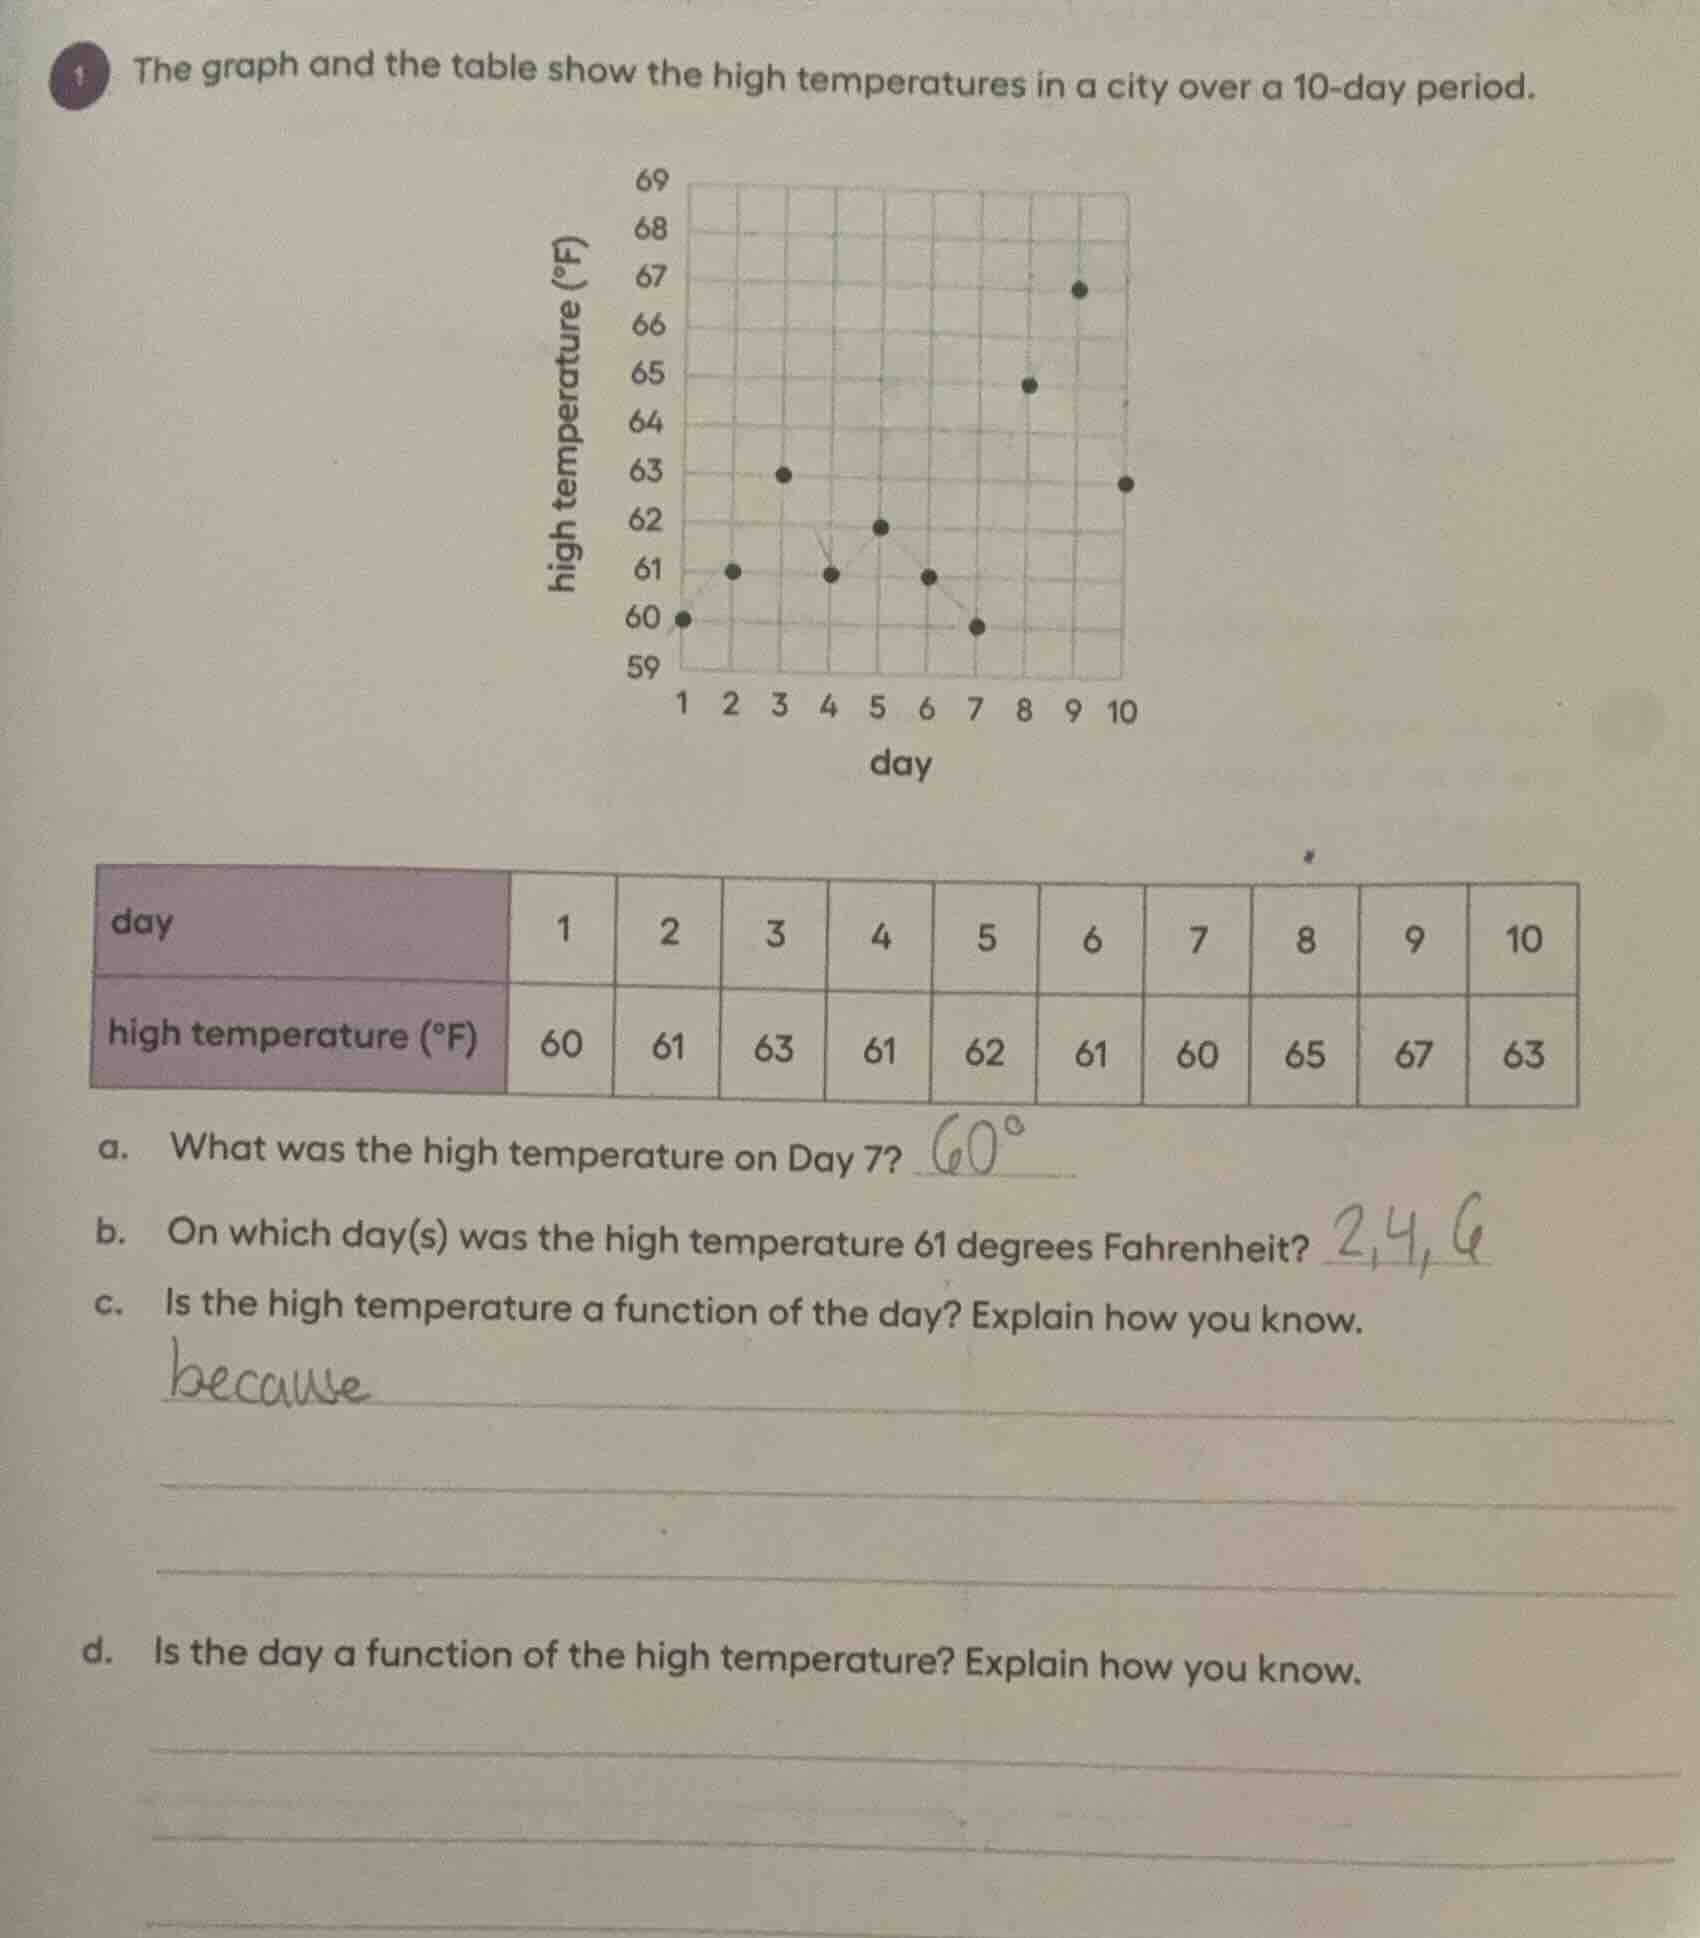
the graph and the table show the high temperatures in a city over a 10 - day period.
a. what was the high temperature on day 7?
b. on which day(s) was the high temperature 61 degrees fahrenheit?
c. is the high temperature a function of the day? explain how you know.
d. is the day a function of the high temperature? explain how you know.
Part a
Step1: Find Day 7 in table
Look at the table, find the row for "high temperature" and column for Day 7.
Step2: Read the temperature
The value in Day 7 column for high temperature is 60°F.
Step1: Scan table for 61°F
Look through the "high temperature" row to find where the value is 61°F.
Step2: Identify days
The days with high temperature 61°F are Day 2, Day 4, and Day 6.
A function requires each input (day) to have exactly one output (high temperature). For each day (1 - 10), there's only one high temperature. So, high temperature is a function of day.

Snap & solve any problem in the app
Get step-by-step solutions on Sovi AI
Photo-based solutions with guided steps
Explore more problems and detailed explanations
60°F