QUESTION IMAGE
Question
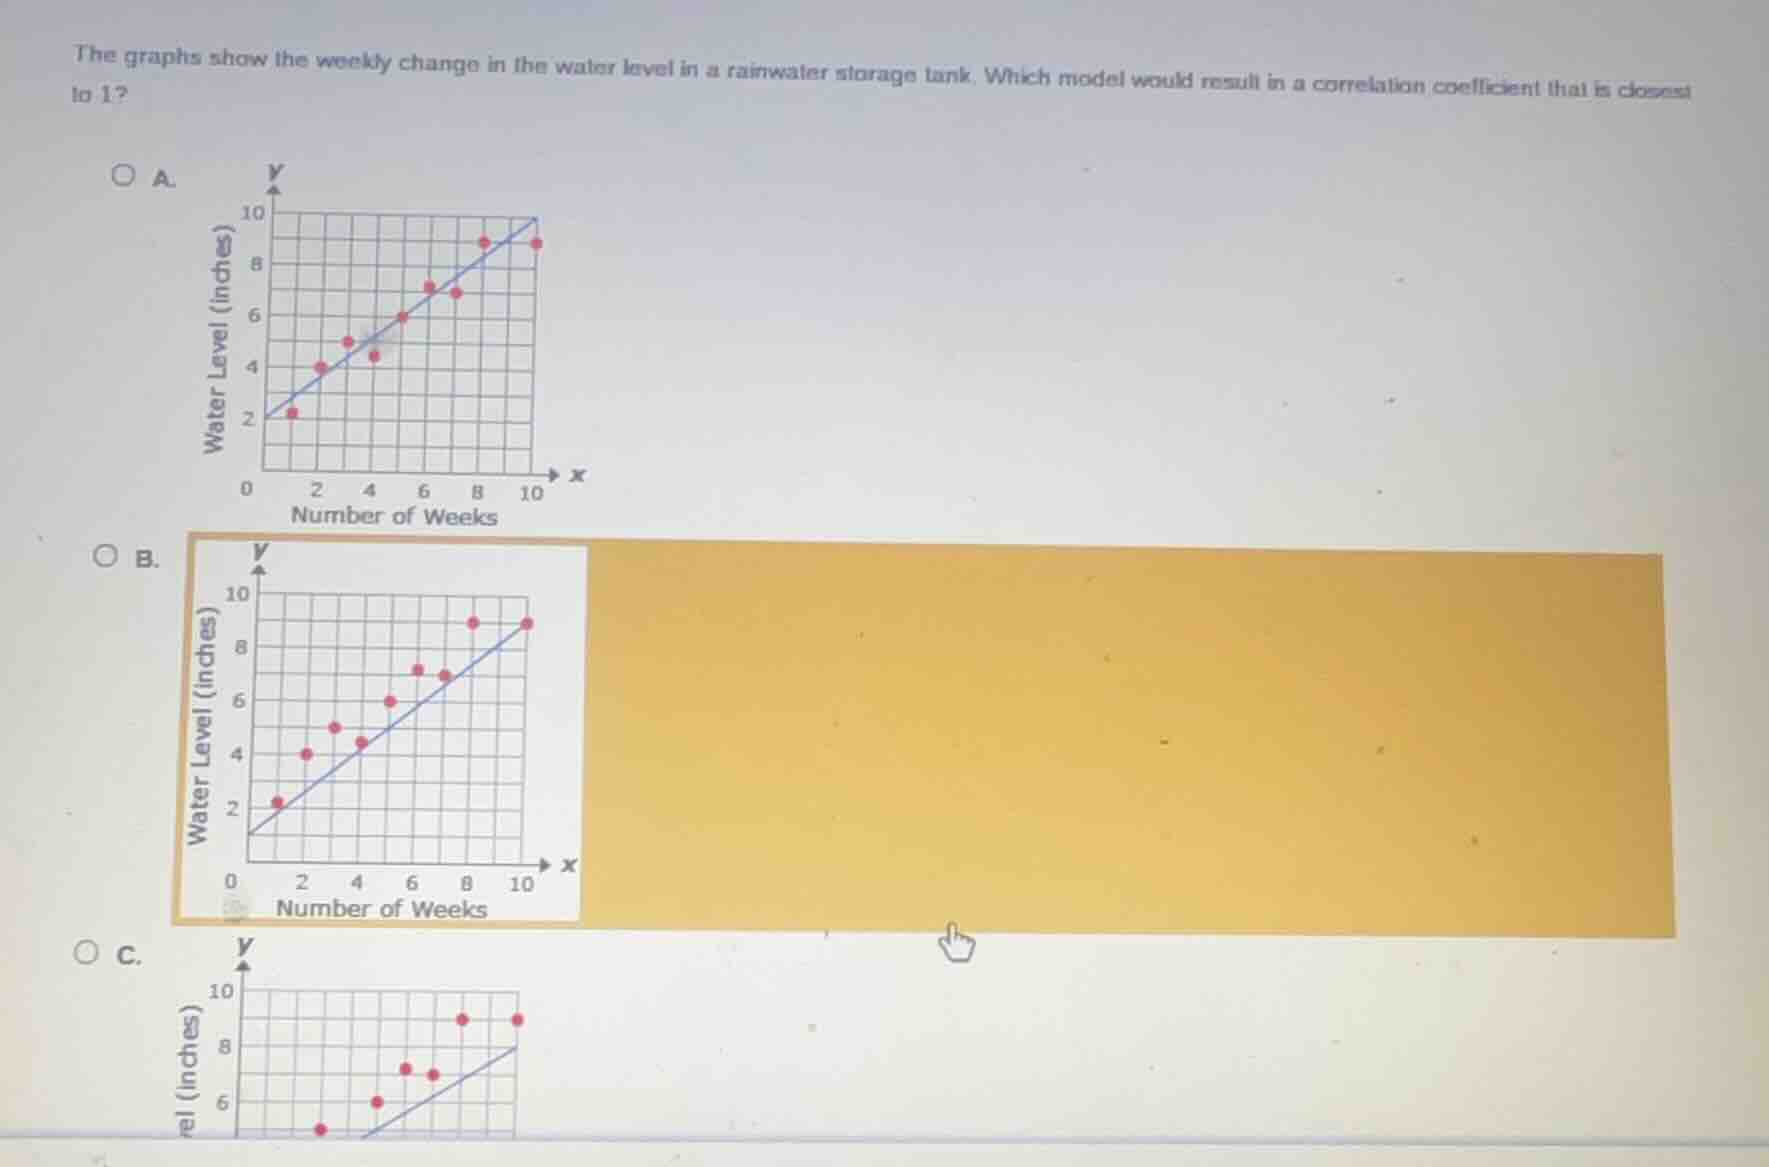
the graphs show the weekly change in the water level in a rainwater storage tank. which model would result in a correlation coefficient that is closest to 1?
a. graph of water level vs number of weeks
b. graph of water level vs number of weeks
c. graph of water level vs number of weeks
Step1: Understand correlation coefficient
A correlation coefficient closest to 1 means the data points have the strongest positive linear relationship, i.e., points lie nearly on the positive trend line.
Step2: Compare scatter plots
- Plot A: Points are close to the trend line but have some spread.
- Plot B: Points are very tightly clustered along the positive trend line, with minimal deviation.
- Plot C: Points are far from the trend line, showing weak linearity.

Snap & solve any problem in the app
Get step-by-step solutions on Sovi AI
Photo-based solutions with guided steps
Explore more problems and detailed explanations
B. <The scatter plot with points tightly clustered along the positive trend line, where x is Number of Weeks and y is Water Level (inches)>