QUESTION IMAGE
Question
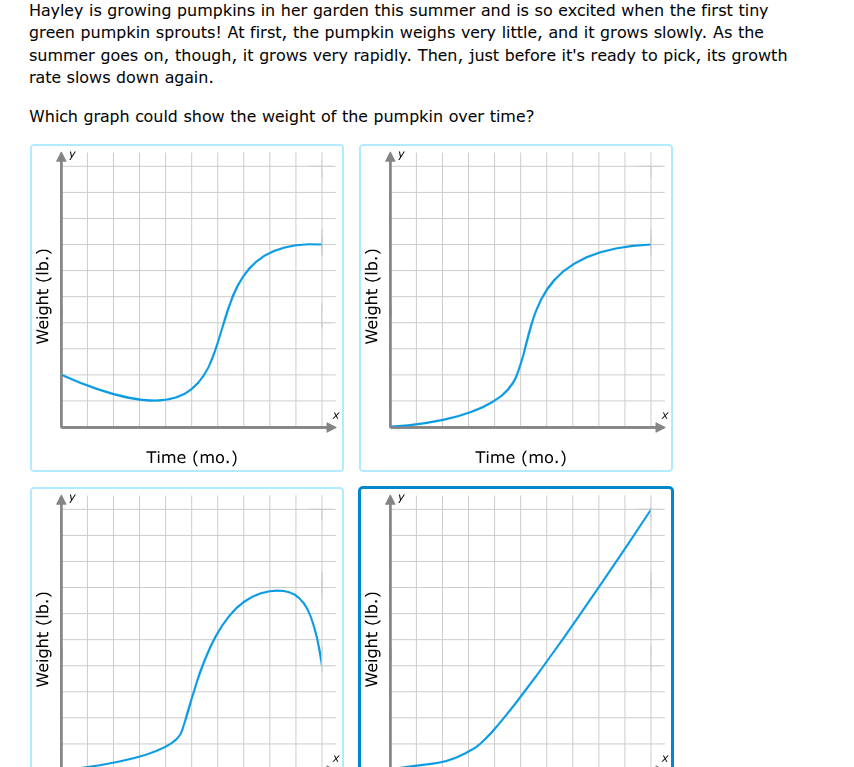
hayley is growing pumpkins in her garden this summer and is so excited when the first tiny green pumpkin sprouts! at first, the pumpkin weighs very little, and it grows slowly. as the summer goes on, though, it grows very rapidly. then, just before its ready to pick, its growth rate slows down again. which graph could show the weight of the pumpkin over time?
Step1: Analyze the pumpkin's growth pattern
The pumpkin starts with little weight, grows slowly at first, then rapidly, and finally slows down growth (but still gains weight, not decreases or has a constant rate). So the graph should have: initial slow increase, then steeper increase, then less steep (but still increasing) as time (x - axis) increases and weight (y - axis) increases.
Step2: Evaluate each graph
- First graph: Decreases at first, which doesn't match (pumpkin should grow, not lose weight initially).
- Second graph: Starts low, grows slowly, then rapidly, then growth slows (curve becomes less steep) as it approaches a limit (ready to pick, still growing but slower). This matches.
- Third graph: Decreases at the end, which is wrong (pumpkin doesn't lose weight before picking).
- Fourth graph: Has a constant (or increasing) growth rate at the end, but should slow down, so the curve should flatten more, not be a straight line (constant rate) at the end.

Snap & solve any problem in the app
Get step-by-step solutions on Sovi AI
Photo-based solutions with guided steps
Explore more problems and detailed explanations
The second graph (the one in the top - right among the four, with weight starting low, growing slowly then rapidly then slowing growth without decreasing)