QUESTION IMAGE
Question
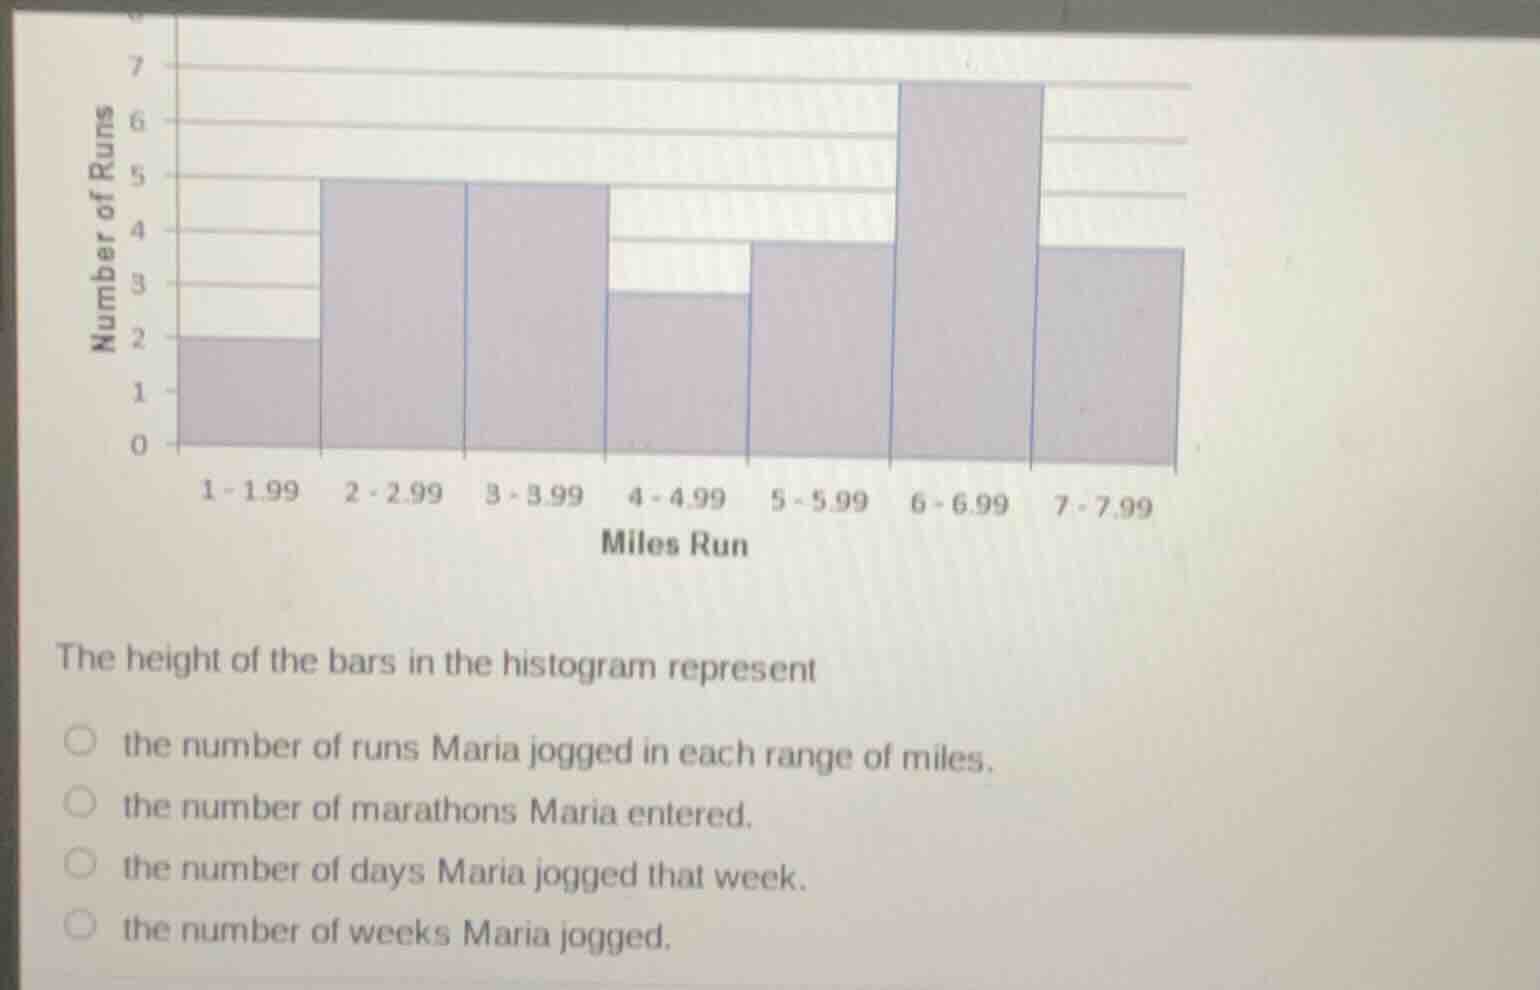
the height of the bars in the histogram represent
the number of runs maria jogged in each range of miles.
the number of marathons maria entered.
the number of days maria jogged that week.
the number of weeks maria jogged.
Brief Explanations
The y-axis of the histogram is labeled "Number of Runs", and the x-axis shows ranges of miles run. The height of each bar corresponds to how many runs fall into each mile range, which matches the first option. The other options do not align with the labels and context of the histogram.

Snap & solve any problem in the app
Get step-by-step solutions on Sovi AI
Photo-based solutions with guided steps
Explore more problems and detailed explanations
the number of runs Maria jogged in each range of miles.