QUESTION IMAGE
Question
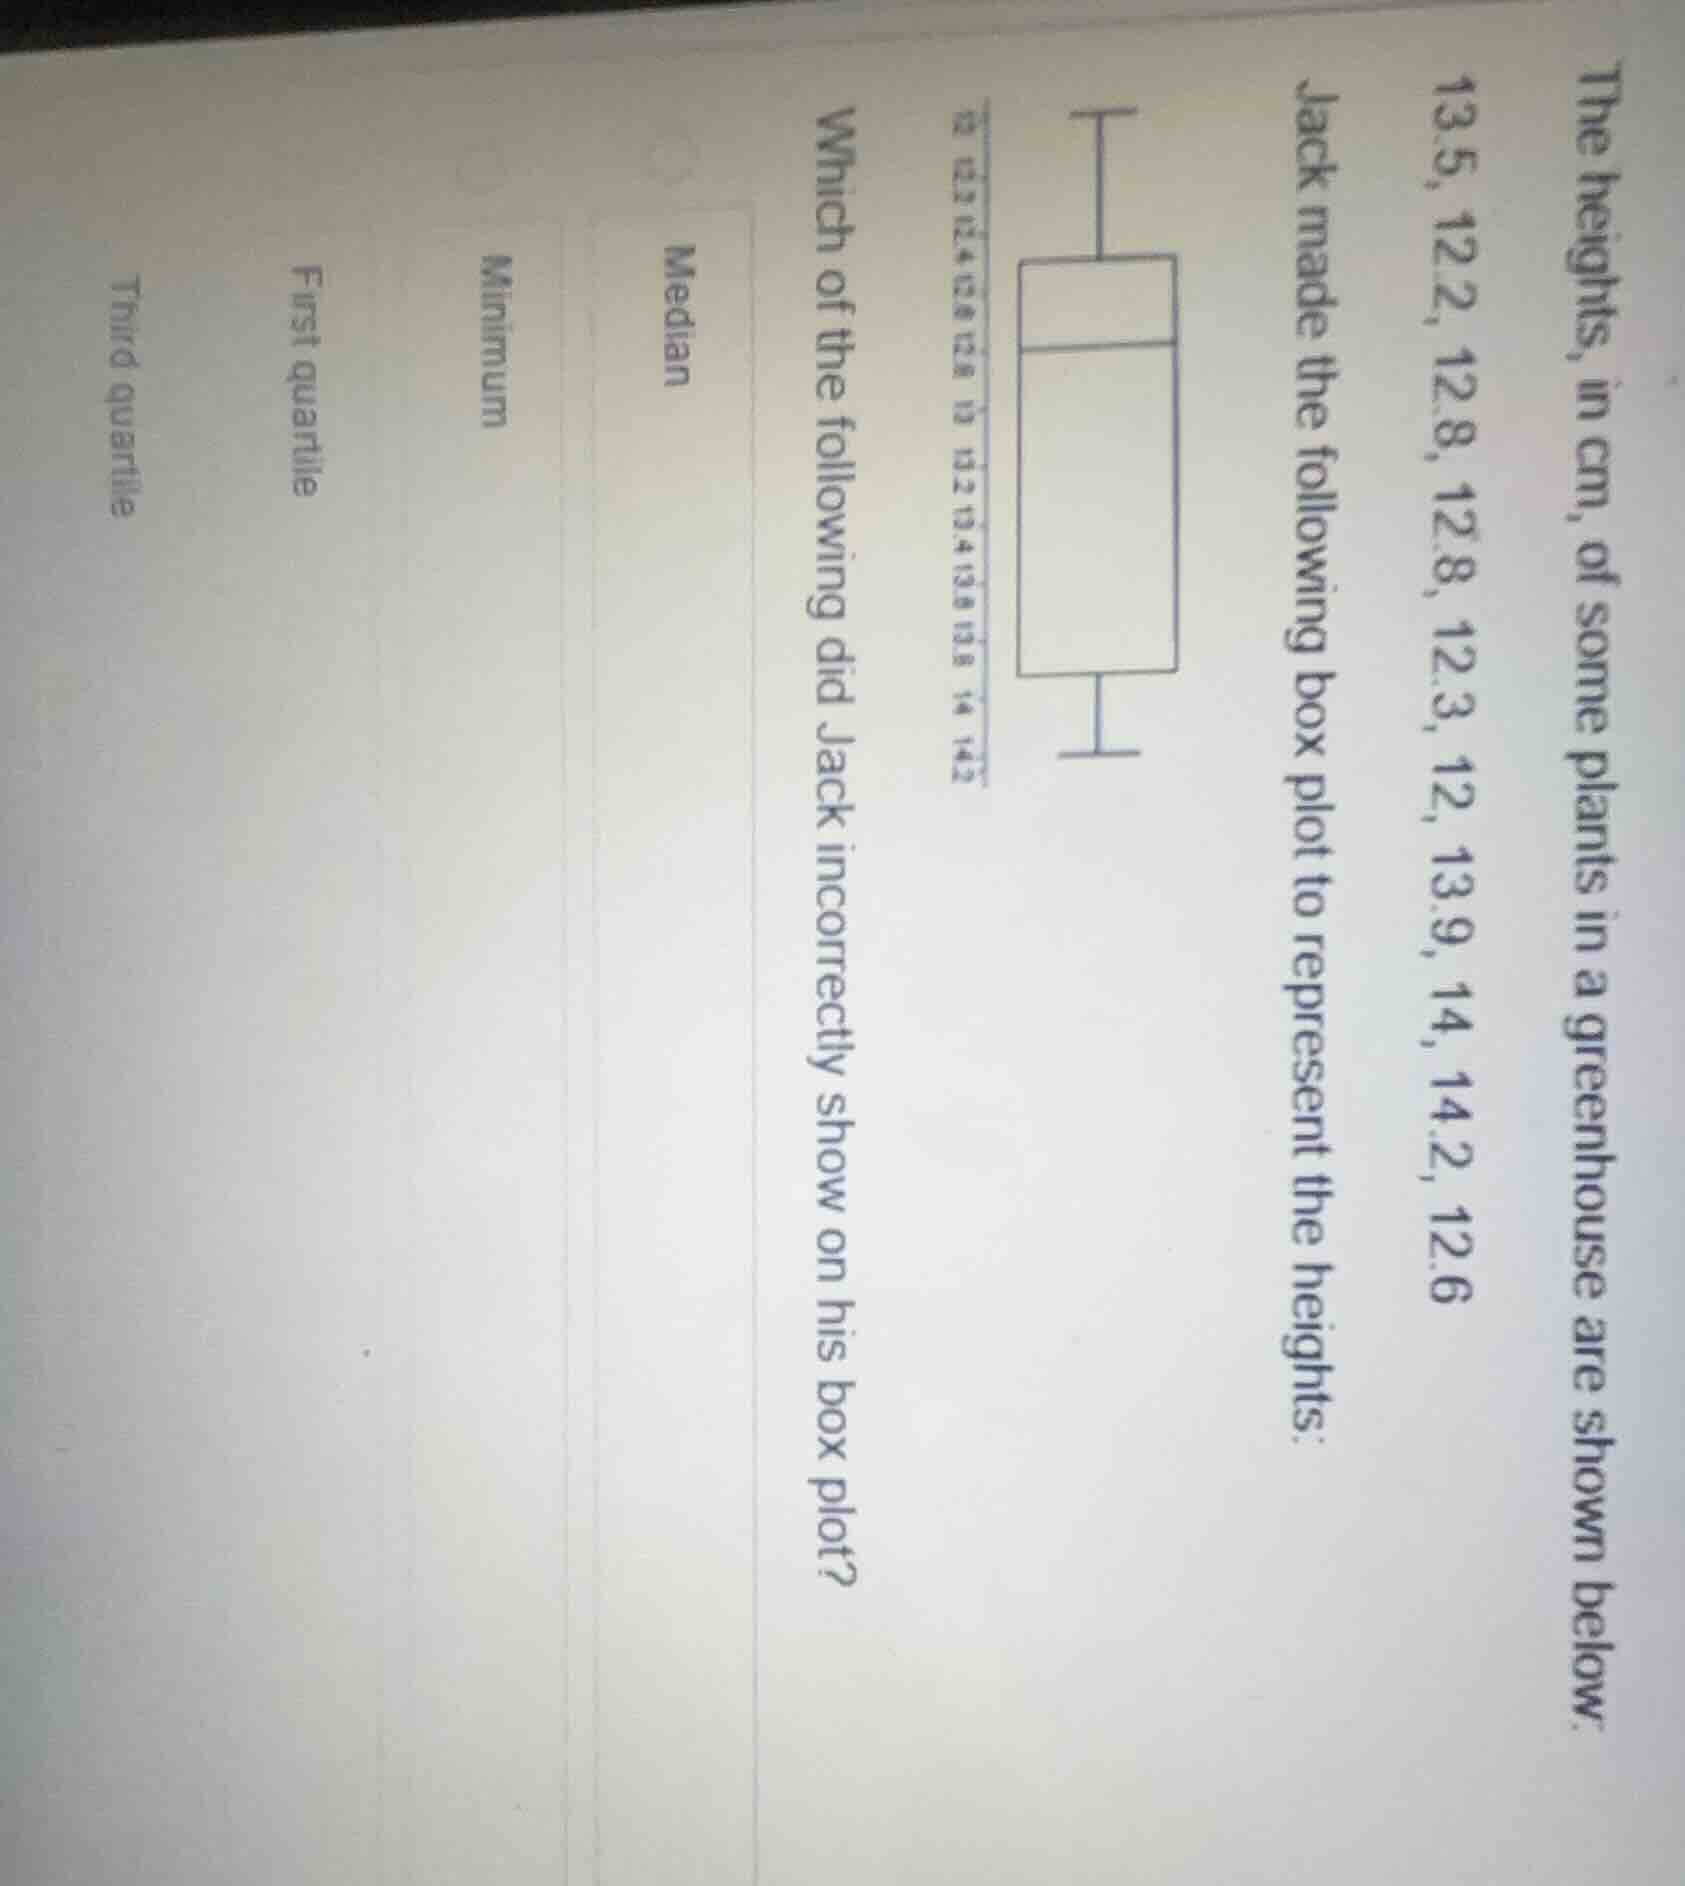
the heights, in cm, of some plants in a greenhouse are shown below. 13.5, 12.2, 12.8, 12.8, 12.3, 12, 13.9, 14, 14.2, 12.6 jack made the following box plot to represent the heights. which of the following did jack incorrectly show on his box plot? median minimum first quartile third quartile
Step1: Sort the height data
Sorted data: $12, 12.2, 12.3, 12.6, 12.8, 12.8, 13.5, 13.9, 14, 14.2$
Step2: Find minimum value
Minimum = smallest value = $12$
Step3: Calculate median (Q2)
For $n=10$, median = $\frac{5^{th}+6^{th}}{2} = \frac{12.8+12.8}{2} = 12.8$
Step4: Calculate first quartile (Q1)
Lower half: $12, 12.2, 12.3, 12.6, 12.8$
Q1 = median of lower half = $12.3$
Step5: Calculate third quartile (Q3)
Upper half: $12.8, 13.5, 13.9, 14, 14.2$
Q3 = median of upper half = $13.9$
Step6: Compare to box plot
Box plot shows: Min=$12$, Q1=$12.2$, Median=$12.8$, Q3=$13.9$, Max=$14.2$. The incorrect value is Q1.

Snap & solve any problem in the app
Get step-by-step solutions on Sovi AI
Photo-based solutions with guided steps
Explore more problems and detailed explanations
First quartile