QUESTION IMAGE
Question
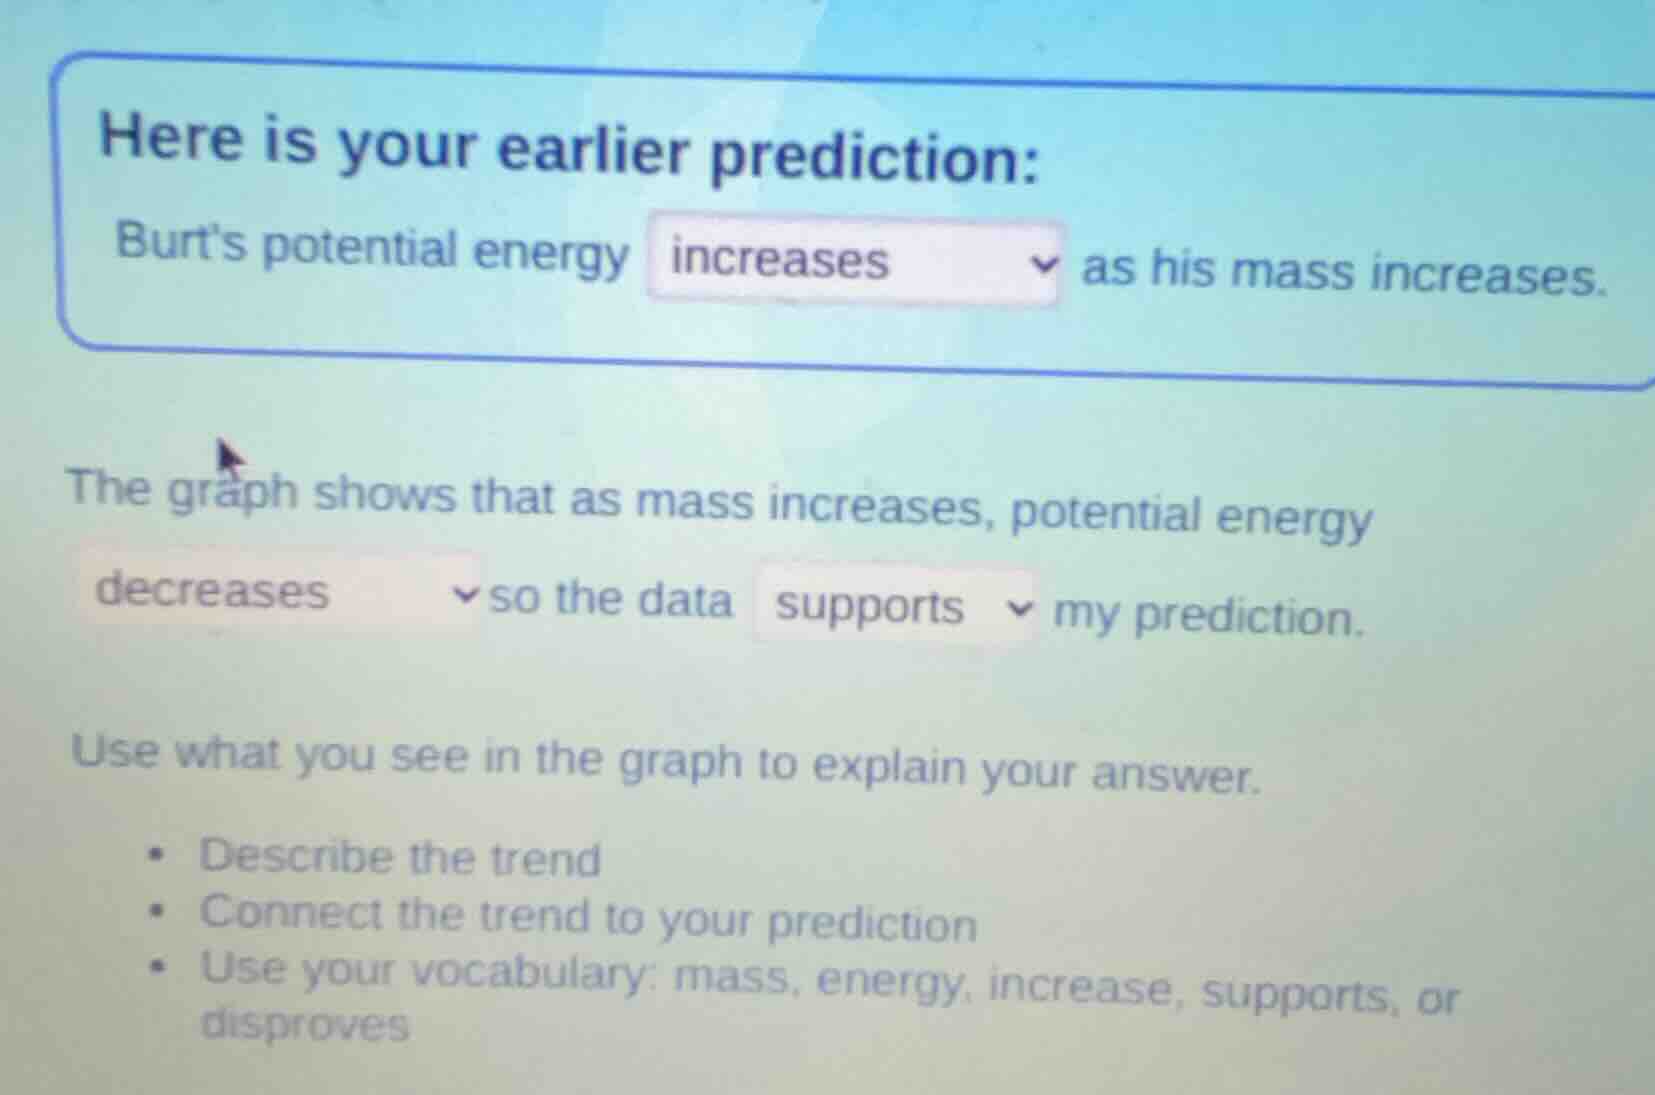
here is your earlier prediction:
burts potential energy increases as his mass increases.
the graph shows that as mass increases, potential energy
decreases so the data supports my prediction.
use what you see in the graph to explain your answer.
- describe the trend
- connect the trend to your prediction
- use your vocabulary: mass, energy, increase, supports, or disproves
First, correct the trend from the graph: as mass increases, potential energy increases (aligning with the physics formula for gravitational potential energy $PE = mgh$, where mass $m$ directly correlates with potential energy $PE$ when height $h$ and gravity $g$ are constant). This upward trend matches the original prediction that potential energy increases with mass, so the data supports the prediction.

Snap & solve any problem in the app
Get step-by-step solutions on Sovi AI
Photo-based solutions with guided steps
Explore more problems and detailed explanations
- Trend: As mass increases, potential energy increases.
- Connection: This upward trend matches the prediction that Burt's potential energy increases as his mass increases.
- Conclusion: The data supports my prediction, because potential energy shows a direct increase alongside increasing mass, which aligns with the initial claim.