QUESTION IMAGE
Question
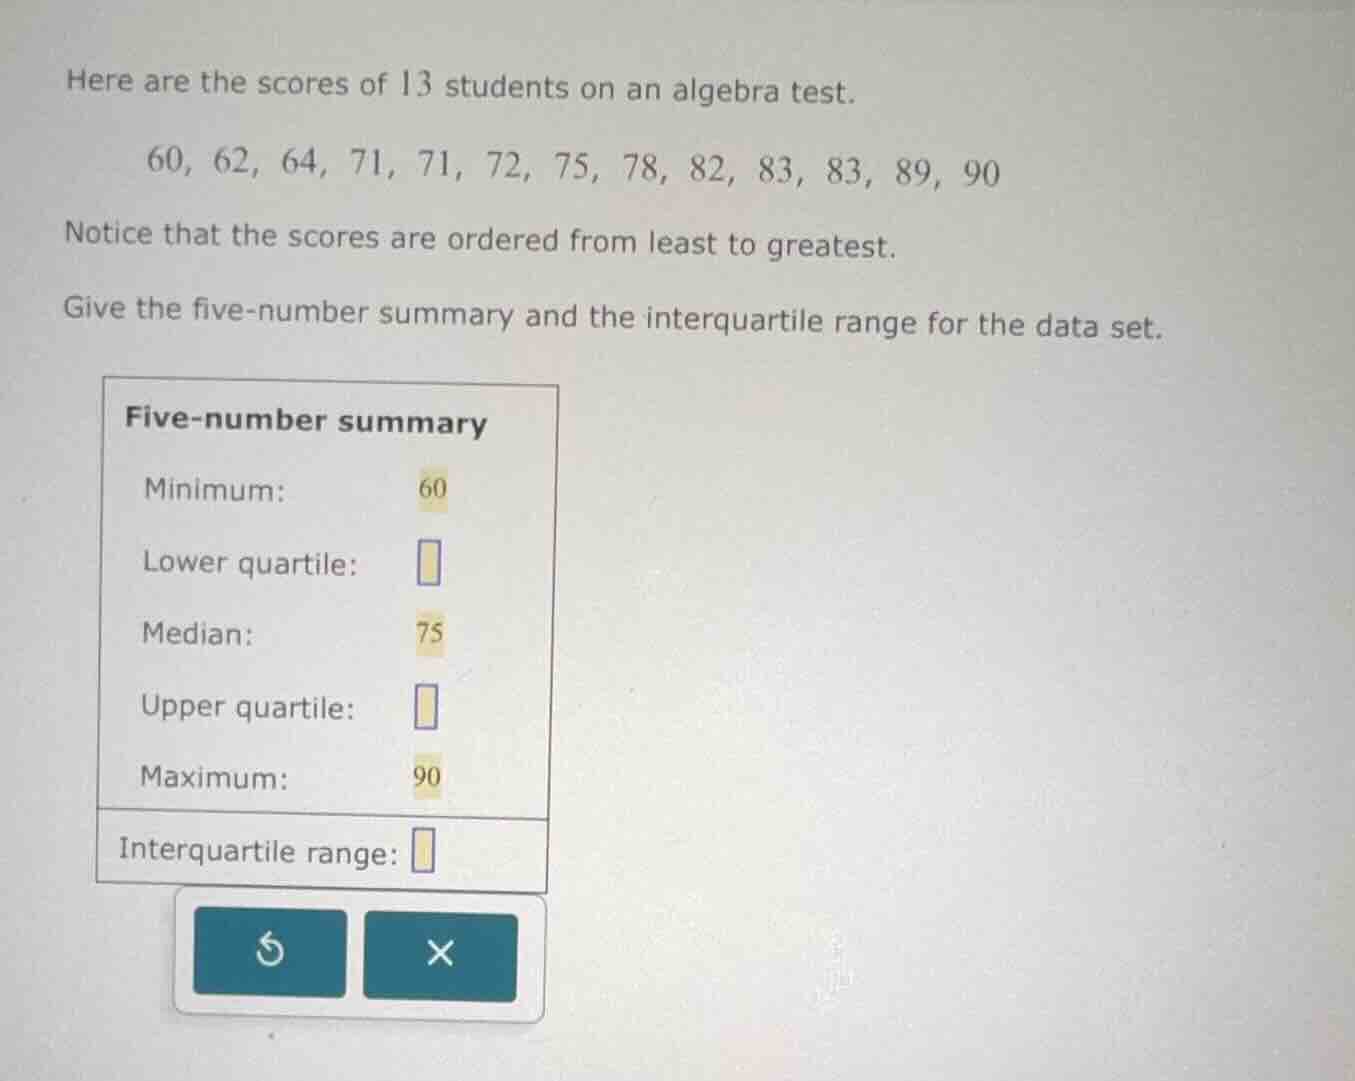
here are the scores of 13 students on an algebra test.
60, 62, 64, 71, 71, 72, 75, 78, 82, 83, 83, 89, 90
notice that the scores are ordered from least to greatest.
give the five-number summary and the interquartile range for the data set.
five-number summary
minimum: 60
lower quartile:
median: 75
upper quartile:
maximum: 90
interquartile range:
Step1: Find lower quartile (Q1)
The data set has 13 values. The median (75, 7th value) splits the data into lower half: [60, 62, 64, 71, 71, 72]. The median of this subset is the average of the 3rd and 4th values:
$\frac{64 + 71}{2} = 67.5$
Step2: Find upper quartile (Q3)
The upper half of the data is [78, 82, 83, 83, 89, 90]. The median of this subset is the average of the 3rd and 4th values:
$\frac{83 + 83}{2} = 83$
Step3: Calculate interquartile range
Subtract Q1 from Q3:
$83 - 67.5 = 15.5$

Snap & solve any problem in the app
Get step-by-step solutions on Sovi AI
Photo-based solutions with guided steps
Explore more problems and detailed explanations
Five-number summary
Minimum: 60
Lower quartile: 67.5
Median: 75
Upper quartile: 83
Maximum: 90