QUESTION IMAGE
Question
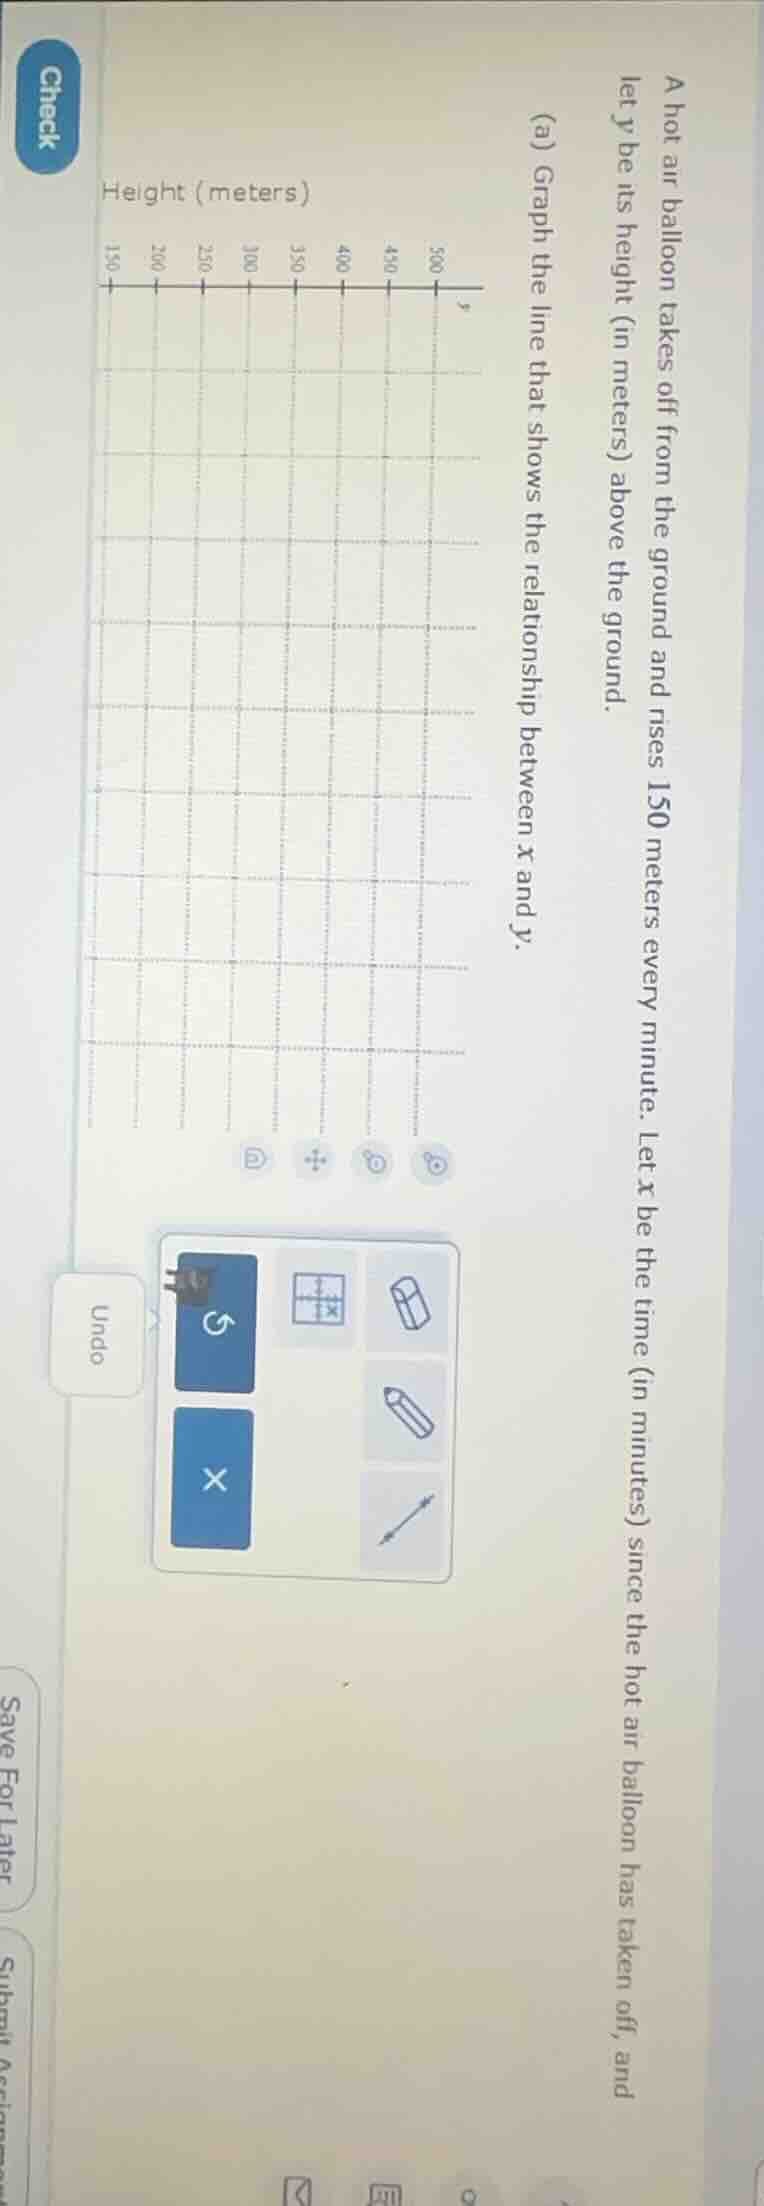
a hot air balloon takes off from the ground and rises 150 meters every minute. let x be the time (in minutes) since the hot air balloon has taken off, and let y be its height (in meters) above the ground.
(a) graph the line that shows the relationship between x and y.
height (meters)
Step1: Define the relationship equation
The balloon rises 150 meters per minute, starting from 0 height. So the linear relationship is $y = 150x$.
Step2: Identify key points to plot
- When $x=0$, $y=150(0)=0$, so point $(0, 0)$.
- When $x=1$, $y=150(1)=150$, so point $(1, 150)$.
- When $x=2$, $y=150(2)=300$, so point $(2, 300)$.
- When $x=3$, $y=150(3)=450$, so point $(3, 450)$.
Step3: Plot points and draw line
Mark the points $(0,0)$, $(1,150)$, $(2,300)$, $(3,450)$ on the graph, then draw a straight line through them (extending beyond the points as the relationship is continuous for positive $x$).

Snap & solve any problem in the app
Get step-by-step solutions on Sovi AI
Photo-based solutions with guided steps
Explore more problems and detailed explanations
The line representing $y=150x$ is drawn by plotting the points $(0,0)$, $(1,150)$, $(2,300)$, $(3,450)$ and connecting them with a straight line, extending infinitely in[LLM SSE On Failure]