QUESTION IMAGE
Question
Question was provided via image upload.
Step1: List data by intervals
First, sort and count data in each interval:
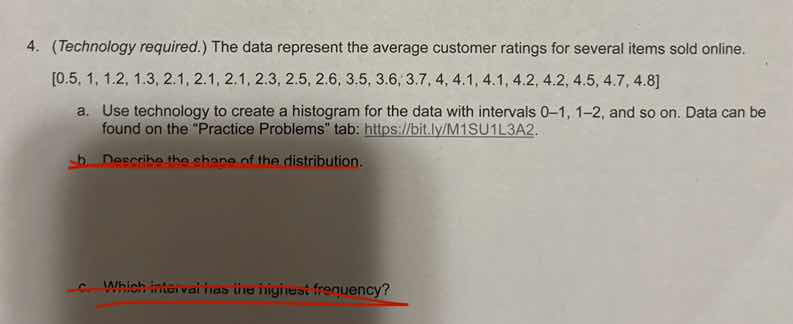
- 0-1: [0.5, 1] → 2 values
- 1-2: [1.2, 1.3] → 2 values
- 2-3: [2.1, 2.1, 2.1, 2.3, 2.5, 2.6] → 6 values
- 3-4: [3.5, 3.6, 3.7, 4] → 4 values
- 4-5: [4.1, 4.1, 4.2, 4.2, 4.5, 4.7, 4.8] → 7 values
Step2: Analyze distribution shape
Compare counts across intervals: left intervals (0-3) have lower counts, right interval (4-5) has the highest count. The tail of the distribution extends to the left.
Step3: Identify highest frequency interval
Compare the counts from Step1: 7 is the largest count, corresponding to the 4-5 interval.

Snap & solve any problem in the app
Get step-by-step solutions on Sovi AI
Photo-based solutions with guided steps
Explore more problems and detailed explanations
b. The distribution is left-skewed (negatively skewed), as the highest frequency is in the rightmost interval and the tail extends toward lower values.
c. 4-5