QUESTION IMAGE
Question
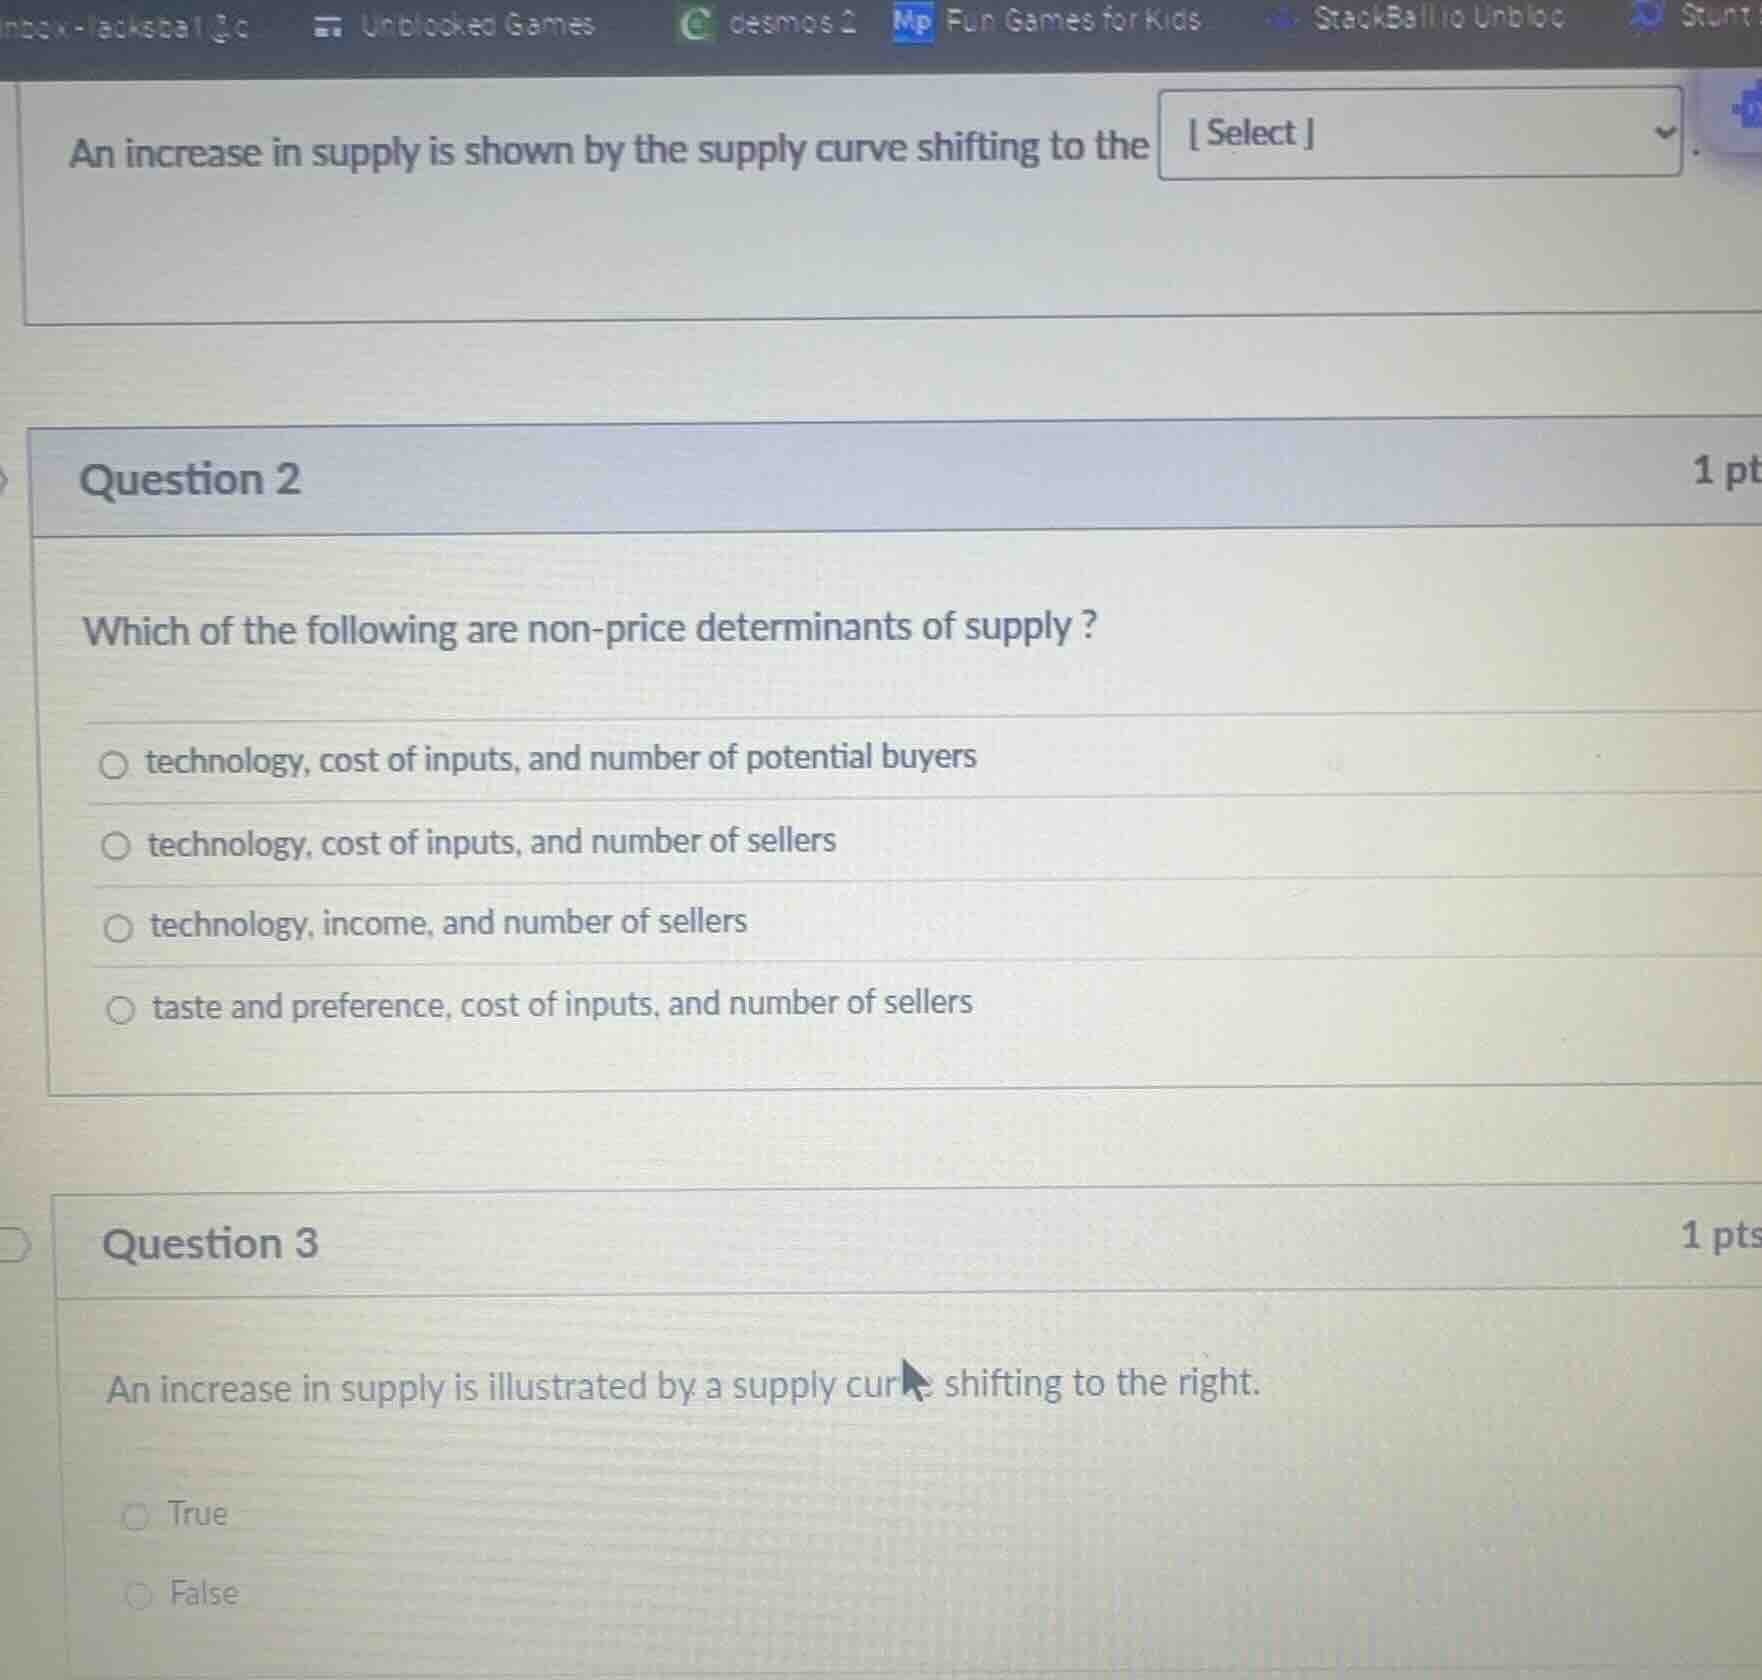
an increase in supply is shown by the supply curve shifting to the select . question 2 1 pt which of the following are non - price determinants of supply? technology, cost of inputs, and number of potential buyers technology, cost of inputs, and number of sellers technology, income, and number of sellers taste and preference, cost of inputs, and number of sellers question 3 1 pts an increase in supply is illustrated by a supply cur shifting to the right. true false
Question 1 (First Dropdown)
In supply - demand analysis, an increase in supply means that at each given price level, a greater quantity of the good is supplied. This is represented by the supply curve shifting to the right. For example, if a new technology makes production more efficient, producers can supply more at every price, and the supply curve shifts right.
- Non - price determinants of supply are factors that affect the quantity supplied of a good or service other than the price of the good itself.
- Technology: Better technology can increase production efficiency, so producers can supply more at each price.
- Cost of inputs: If the cost of raw materials (inputs) decreases, production becomes cheaper, and producers are willing to supply more at each price.
- Number of sellers: More sellers in the market mean a greater total supply in the market at each price.
- Now let's analyze the options:
- Option 1: "number of potential buyers" is a non - price determinant of demand, not supply. So this option is incorrect.
- Option 2: Technology, cost of inputs, and number of sellers are all non - price determinants of supply. This option is correct.
- Option 3: "income" is a non - price determinant of demand (it affects the quantity demanded by consumers), not supply. So this option is incorrect.
- Option 4: "taste and preference" is a non - price determinant of demand (it affects what consumers want to buy), not supply. So this option is incorrect.
As we know from the concept of supply curves, an increase in supply (caused by non - price factors like technology improvement, decrease in input costs, increase in number of sellers etc.) means that at every price level, the quantity supplied is greater. This is graphically represented by the supply curve shifting to the right. For example, if a new production method is introduced in the smartphone industry, more smartphones can be produced at each price, and the supply curve for smartphones shifts to the right.

Snap & solve any problem in the app
Get step-by-step solutions on Sovi AI
Photo-based solutions with guided steps
Explore more problems and detailed explanations
right