QUESTION IMAGE
Question
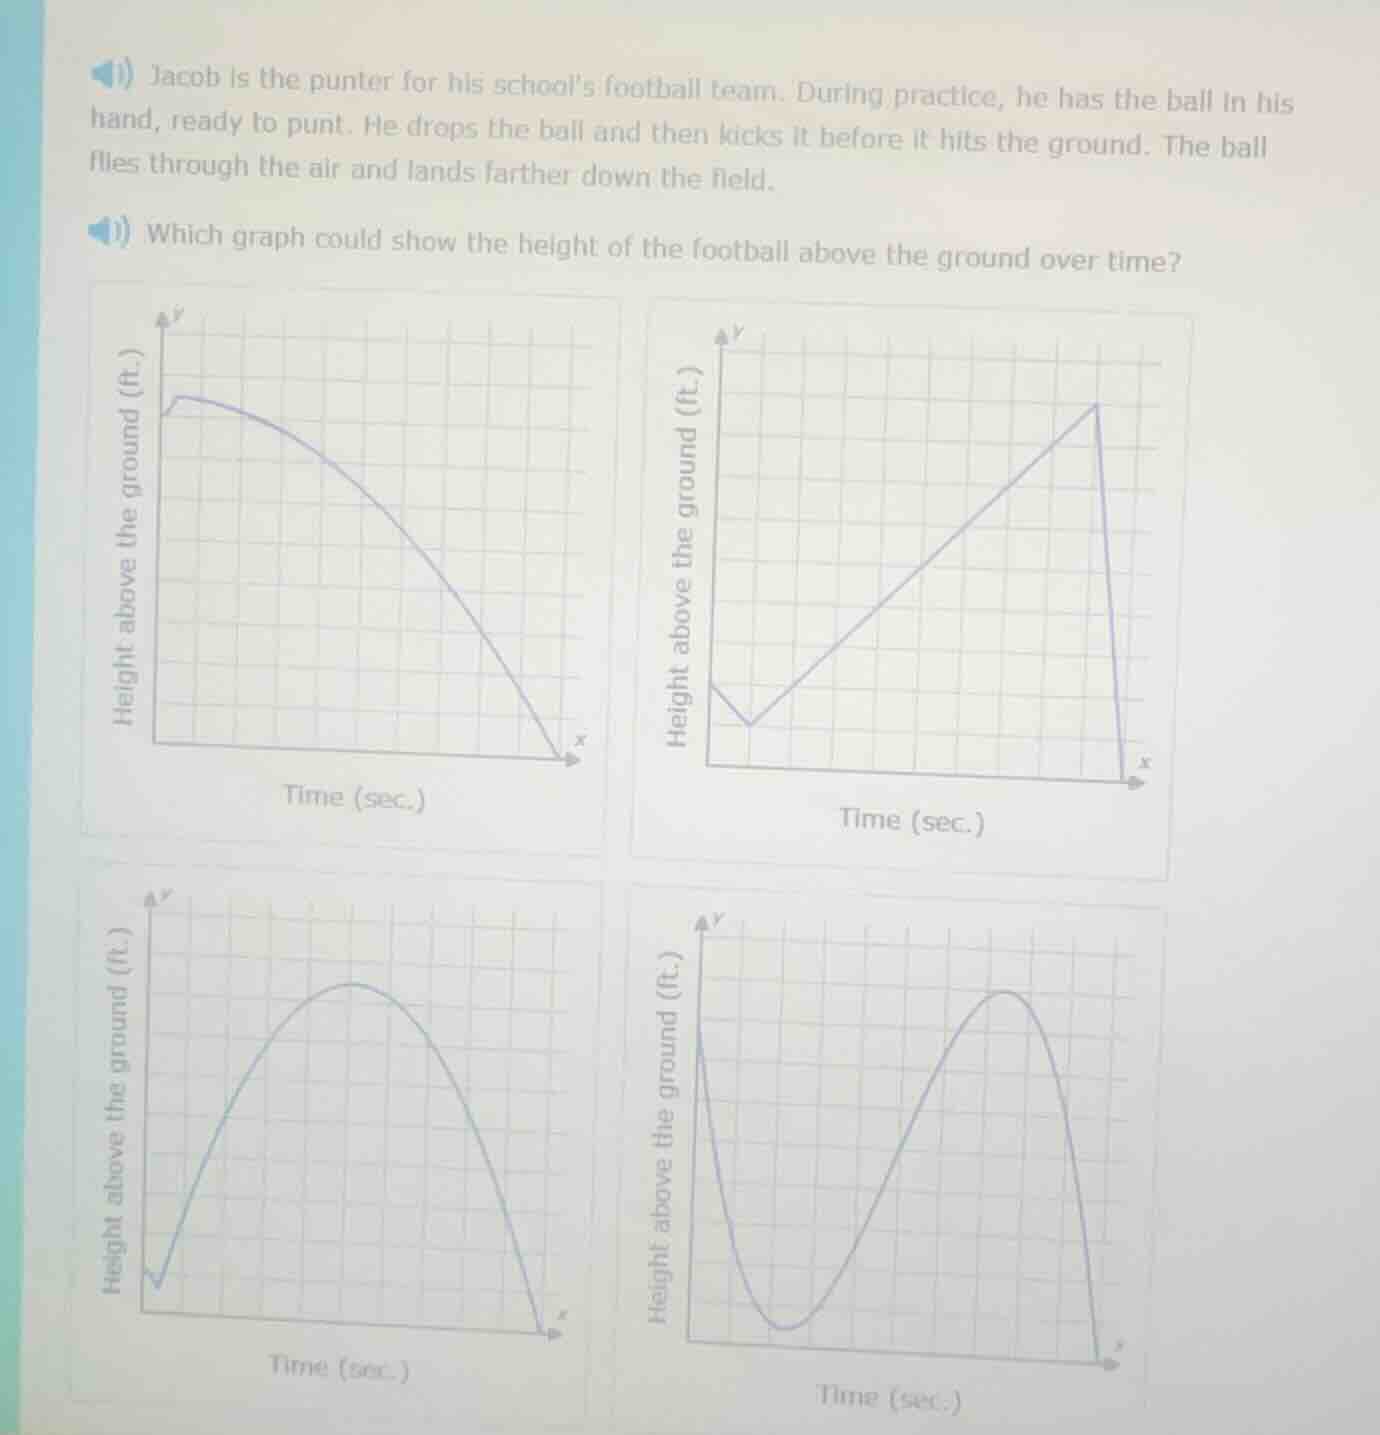
jacob is the punter for his schools football team. during practice, he has the ball in his hand, ready to punt. he drops the ball and then kicks it before it hits the ground. the ball flies through the air and lands farther down the field. which graph could show the height of the football above the ground over time?
Step1: Analyze the motion of the football
Jacob drops the ball first, so initially, the height should decrease a bit (as he drops it) and then when he kicks it, the ball will go up, reach a peak, and then come down to the ground. So the graph should show a small dip first (when dropping), then a rise to a maximum height, and then a fall to zero.
Step2: Evaluate each graph
- First graph: It starts with a small rise then a continuous fall. Doesn't match the drop - kick - rise - fall pattern.
- Second graph: Has a sharp angle and a linear rise, which is not the motion of a projectile (the ball's motion after kicking is projectile motion, which is parabolic).
- Third graph: Shows a small dip (dropping the ball), then a rise to a peak (kicking and projectile motion up), then a fall to the ground. This matches the motion.
- Fourth graph: Has two peaks, which doesn't match the described motion (only one kick, so one peak after the initial drop).

Snap & solve any problem in the app
Get step-by-step solutions on Sovi AI
Photo-based solutions with guided steps
Explore more problems and detailed explanations
The third graph (the one with a small dip at the start, then a rise to a peak, then a fall to the ground)