QUESTION IMAGE
Question
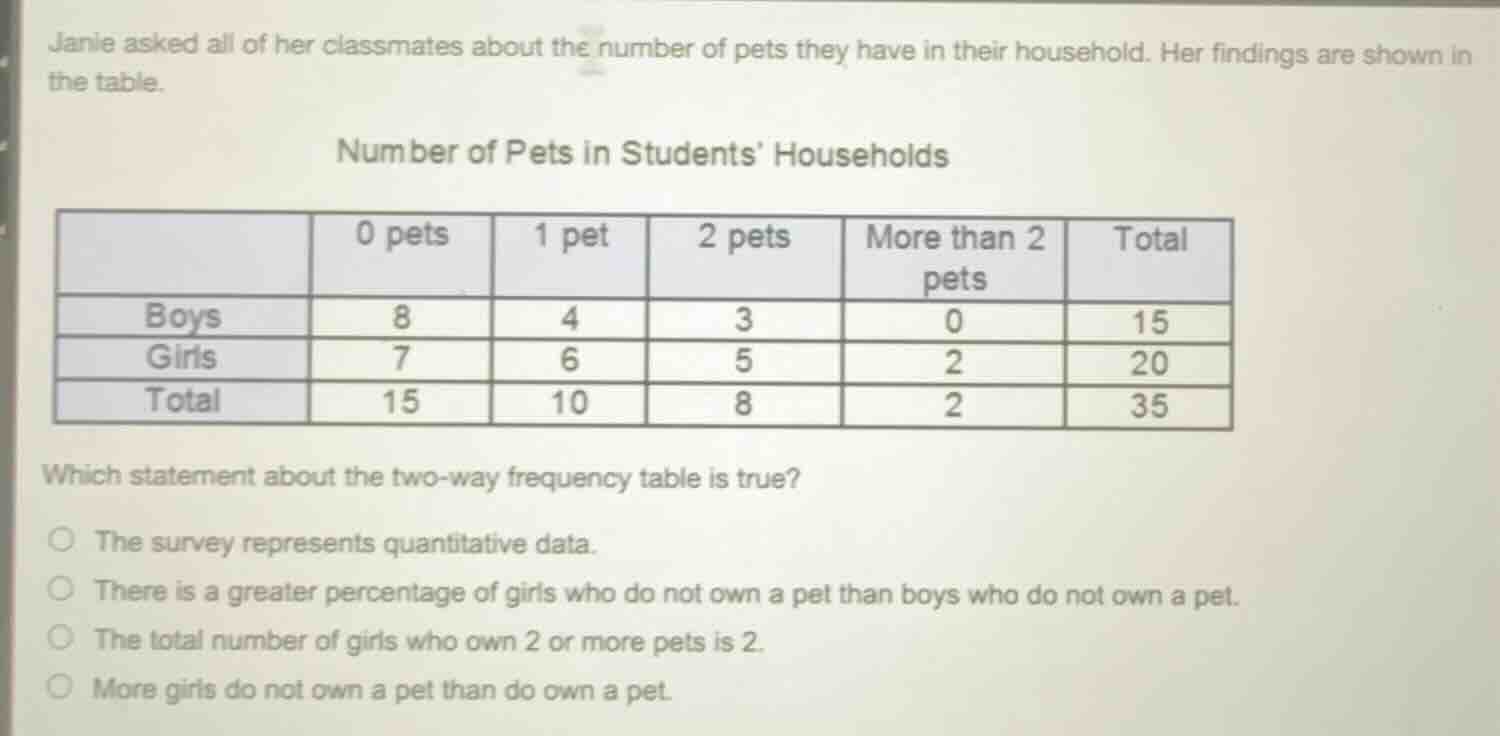
janle asked all of her classmates about the number of pets they have in their household. her findings are shown in the table.
number of pets in students households
| 0 pets | 1 pet | 2 pets | more than 2 pets | total | |
|---|---|---|---|---|---|
| girls | 7 | 6 | 5 | 2 | 20 |
| total | 15 | 10 | 8 | 2 | 35 |
which statement about the two - way frequency table is true?
- the survey represents quantitative data.
- there is a greater percentage of girls who do not own a pet than boys who do not own a pet.
- the total number of girls who own 2 or more pets is 2.
- more girls do not own a pet than do own a pet.
Brief Explanations
- Analyze Option 1: Quantitative data is numerical and measurable. The survey counts pet numbers, which is quantitative, but we check other options to confirm.
- Analyze Option 2: Calculate percentage of boys with 0 pets: $\frac{8}{15} \times 100 \approx 53.3\%$. Percentage of girls with 0 pets: $\frac{7}{20} \times 100 = 35\%$. Boys have a higher percentage, so this is false.
- Analyze Option 3: Girls with 2 pets: 5, girls with more than 2 pets: 2. Total with 2 or more: $5+2=7$, not 2. This is false.
- Analyze Option 4: Girls who do not own a pet: 7. Girls who own a pet: $20-7=13$. 7 is less than 13, so this is false.
- Confirm Option 1: The data consists of numerical counts of pets, which fits the definition of quantitative data.

Snap & solve any problem in the app
Get step-by-step solutions on Sovi AI
Photo-based solutions with guided steps
Explore more problems and detailed explanations
The survey represents quantitative data.