QUESTION IMAGE
Question
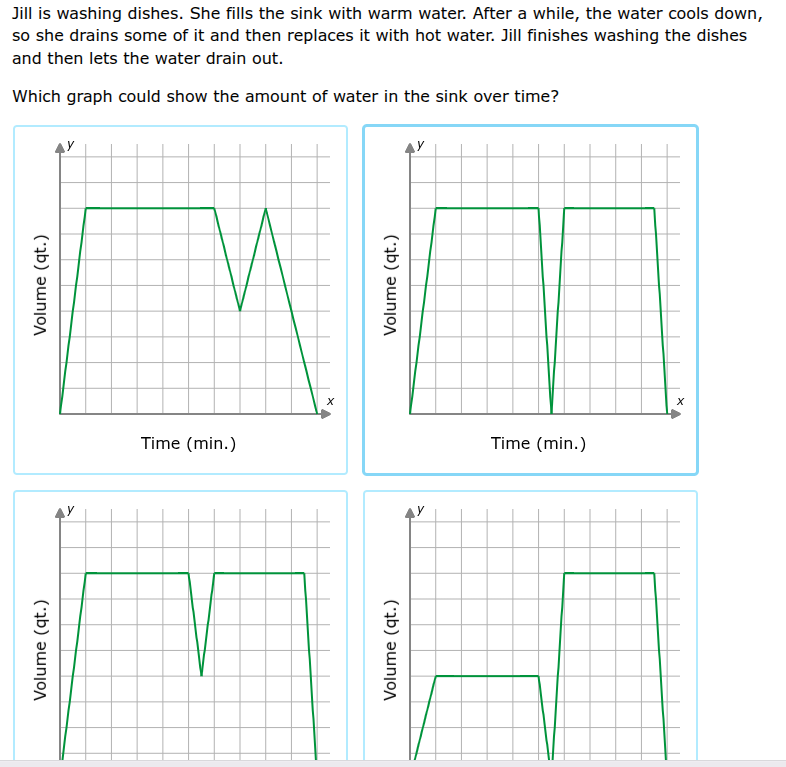
jill is washing dishes. she fills the sink with warm water. after a while, the water cools down, so she drains some of it and then replaces it with hot water. jill finishes washing the dishes and then lets the water drain out. which graph could show the amount of water in the sink over time?
Step1: Analyze initial filling
Jill fills the sink, so volume increases to a constant (when sink is full), so initial part is a rise then flat.
Step2: Draining and replacing
She drains some (volume drops, but not to zero) then replaces with hot water (volume rises back to original level, since she's replacing to continue washing, so should be same as initial full volume).
Step3: Finishing and draining
After washing, she lets water drain out (volume drops to zero). Now check graphs:
- First graph: After draining some, it rises above original? No, should be same.
- Second graph: Drains to zero? No, she drains some, not all, then replaces. Wait, no—wait, when she drains some, does she drain to zero? No, the problem says "drains some of it and then replaces it with hot water". So when draining, volume decreases (but not to zero), then increases back to original (since she's replacing to have enough water). Then after washing, drains to zero. Wait, maybe I misread. Wait, the second graph: when she drains, does it go to zero? No, the third graph: let's re-express.
Wait, let's list events:
- Fill sink: volume increases to max (flat line).
- Wait (flat line, volume constant).
- Drain some: volume decreases (but not to zero, because she "drains some", so still has water, then replaces with hot water: volume increases back to max (same as before, since she's replacing to continue washing, so same volume).
- Wait (flat line, washing).
- Drain all: volume decreases to zero.
Now check each graph:
- Top-left: After draining some, it rises above max? No, max should be same.
- Top-right: When draining, does it go to zero? No, she drains some, not all. Wait, maybe the "drains some" is draining to a lower level, then replacing to original. Then top-right: when she drains, it goes to zero? No, that would be draining all. So no.
- Bottom-left: Drains some (volume drops, not to zero), then rises back to max (same as initial), then after washing, drains to zero. Let's check: initial fill (rise to max, flat), then drain some (drop, not zero), then rise back to max (flat), then drain to zero. Yes, that matches. Wait, but bottom-left: when she replaces, does it go to max? Yes. Then after washing, drains to zero.
Wait, but the third graph (bottom-left) has:
- Initial: rise, flat.
- Then drain some (drop, not zero), then rise back to flat (same as initial max), then flat (washing), then drain to zero.
The second graph (top-right) when draining, goes to zero, then rises back. But she didn't drain all, she drained some. So the bottom-left: when she drains, it's a drop (not zero), then rise back to max. Then after washing, drain to zero.
Wait, maybe I made a mistake. Let's check the options again. Wait, the problem's graphs:
First graph (top-left): after draining some, it peaks higher than initial? No.
Second graph (top-right): when draining, goes to zero, then rises back. But she drained some, not all, so volume shouldn't go to zero when draining some.
Third graph (bottom-left): drains some (volume drops, not zero), then rises back to initial max, then after washing, drains to zero. Yes, that's correct.
Wait, but the bottom-left graph: let's see the y-axis. The initial fill: rises to a certain level, flat. Then drains some (drops, but not to zero), then rises back to same level, flat, then drains to zero. That matches the events: fill (rise, flat), drain some (drop, not zero), replace (rise, flat), wash (flat), drain (drop to zero).
The bottom-right graph: initial volume is lower, then rises. No, initial should be fill to max.
So the c…

Snap & solve any problem in the app
Get step-by-step solutions on Sovi AI
Photo-based solutions with guided steps
Explore more problems and detailed explanations
The bottom - left graph (the third graph, with the sequence: rise to max, flat, drop (not zero), rise to max, flat, drop to zero)