QUESTION IMAGE
Question
journal
explain how to compare proportional relationships represented in different forms.
remember
you can represent proportional relationships using tables, graphs, and equations.
- in a table, all the ratios of corresponding x- and y-values are constant.
- on a graph, the straight line passes through the origin.
- the equation is in the form y = kx, where k is the constant of proportionality.
practice
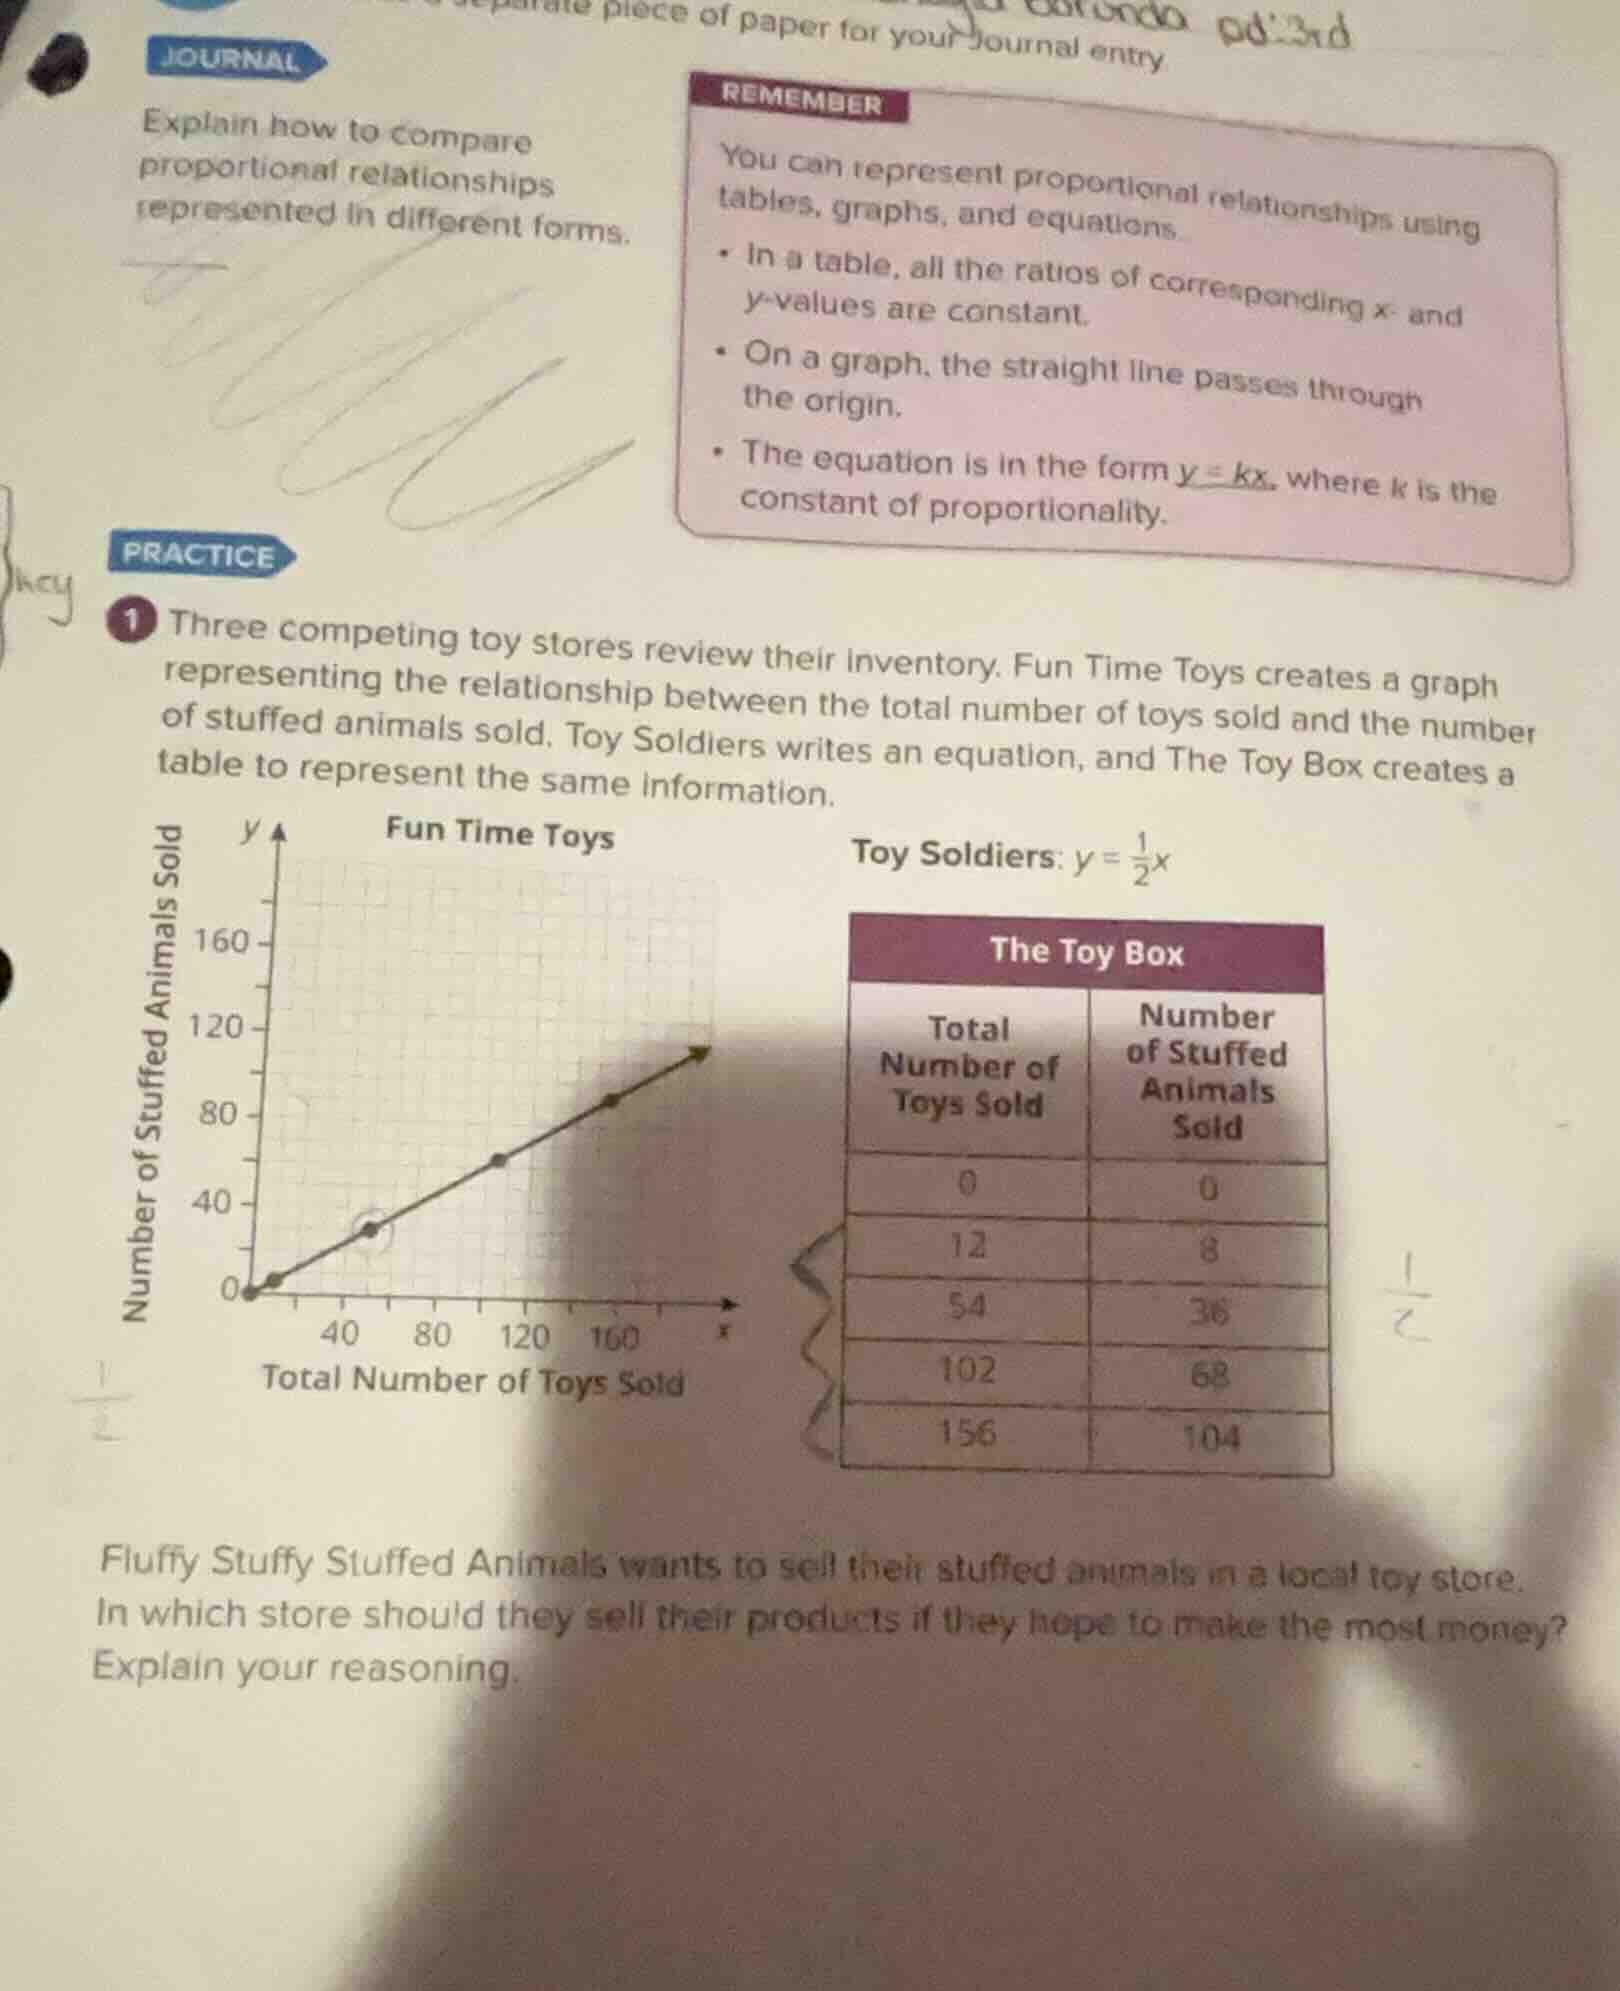
1 three competing toy stores review their inventory. fun time toys creates a graph representing the relationship between the total number of toys sold and the number of stuffed animals sold. toy soldiers writes an equation, and the toy box creates a table to represent the same information.
fun time toys (graph: x-axis total number of toys sold, y-axis number of stuffed animals sold, line through origin)
toy soldiers: $y = \frac{1}{2}x$
the toy box
| total number of toys sold | number of stuffed animals sold |
|---|---|
| 12 | 8 |
| 54 | 36 |
| 102 | 68 |
| 156 | 104 |
fluffy stuffy stuffed animals wants to sell their stuffed animals in a local toy store. in which store should they sell their products if they hope to make the most money? explain your reasoning.
Step1: Find the constant of proportionality for Fun Time Toys (graph)
To find the constant of proportionality \( k \) from the graph, we can pick two points. Let's take the point where \( x = 120 \) (total toys sold) and \( y = 60 \) (stuffed animals sold)? Wait, no, looking at the graph, when \( x = 120 \), what's \( y \)? Wait, the graph has a line through the origin. Let's take two points. Let's see, when \( x = 40 \), what's \( y \)? Wait, the graph: the x-axis is total number of toys sold, y-axis is stuffed animals sold. Let's take a point. Let's say when \( x = 120 \), \( y = 60 \)? Wait, no, maybe better to calculate the slope. The slope \( k=\frac{y}{x} \). Let's take a point from the graph. Let's say when \( x = 120 \), \( y = 60 \)? Wait, no, looking at the graph, the line goes through (120, 60)? Wait, no, maybe I misread. Wait, the graph for Fun Time Toys: let's check the coordinates. Let's see, when \( x = 120 \), what's \( y \)? Wait, the y-axis has 0, 40, 80, 120? Wait, no, the y-axis is "Number of Stuffed Animals Sold" with 0, 40, 80, 120? Wait, the x-axis is "Total Number of Toys Sold" with 0, 40, 80, 120, 160. Wait, the line passes through (120, 60)? Wait, no, maybe a better approach: pick two points. Let's take (0,0) and (120, 60)? Wait, no, maybe (120, 60) is not right. Wait, the graph: when x=120, y=60? Wait, no, let's calculate the slope. Let's take two points. Let's say when x=120, y=60? Wait, no, maybe I made a mistake. Wait, the Toy Soldiers equation is \( y=\frac{1}{2}x \), so \( k=\frac{1}{2}=0.5 \). Let's check Fun Time Toys. Let's take a point from the graph. Let's say when x=120, y=60? Then \( k=\frac{60}{120}=0.5 \)? Wait, no, that's the same as Toy Soldiers? Wait, no, maybe I misread the graph. Wait, maybe the graph has a different slope. Wait, no, let's check The Toy Box's table.
Step2: Find the constant of proportionality for The Toy Box (table)
For a proportional relationship, \( k = \frac{y}{x} \). Let's take the first non - zero row: \( x = 12 \), \( y = 8 \). So \( k=\frac{8}{12}=\frac{2}{3}\approx0.666... \). Let's check another row: \( x = 54 \), \( y = 36 \). \( \frac{36}{54}=\frac{2}{3}\approx0.666... \). Another row: \( x = 102 \), \( y = 68 \). \( \frac{68}{102}=\frac{2}{3}\approx0.666... \). And \( x = 156 \), \( y = 104 \). \( \frac{104}{156}=\frac{2}{3}\approx0.666... \). So the constant of proportionality for The Toy Box is \( \frac{2}{3}\approx0.666... \).
Step3: Find the constant of proportionality for Toy Soldiers (equation)
The equation is \( y=\frac{1}{2}x \), so the constant of proportionality \( k=\frac{1}{2}=0.5 \).
Step4: Find the constant of proportionality for Fun Time Toys (graph)
Let's re - examine the graph. Let's take a point from the graph. Let's say when \( x = 120 \) (total toys sold), what's \( y \) (stuffed animals sold)? Wait, the graph: the line passes through (120, 60)? Wait, no, if we calculate \( \frac{y}{x} \) for Fun Time Toys, let's take a point. Let's say when \( x = 120 \), \( y = 60 \), then \( k=\frac{60}{120}=0.5 \), same as Toy Soldiers. Wait, but that contradicts The Toy Box. Wait, no, maybe I misread the graph. Wait, the graph for Fun Time Toys: let's check the coordinates again. Wait, the y - axis is "Number of Stuffed Animals Sold" with 0, 40, 80, 120? Wait, no, the y - axis has 0, 40, 80, 120? Wait, the x - axis is "Total Number of Toys Sold" with 0, 40, 80, 120, 160. Wait, the line goes through (120, 80)? No, that can't be. Wait, maybe I made a mistake. Wait, let's recalculate The Toy Box's \( k \). For The Toy Box, when \( x = 12 \)…

Snap & solve any problem in the app
Get step-by-step solutions on Sovi AI
Photo-based solutions with guided steps
Explore more problems and detailed explanations
Fluffy Stuffy Stuffed Animals should sell their products at The Toy Box. This is because the constant of proportionality (ratio of stuffed animals sold to total toys sold) for The Toy Box (\( \frac{2}{3}\approx0.666 \)) is greater than that of Toy Soldiers (\( \frac{1}{2} = 0.5 \)) and (assuming the graph for Fun Time Toys also has a constant of proportionality of \( 0.5 \)), a higher proportion of stuffed animals sold relative to total toys sold means more sales of their stuffed animals, leading to more money.