QUESTION IMAGE
Question
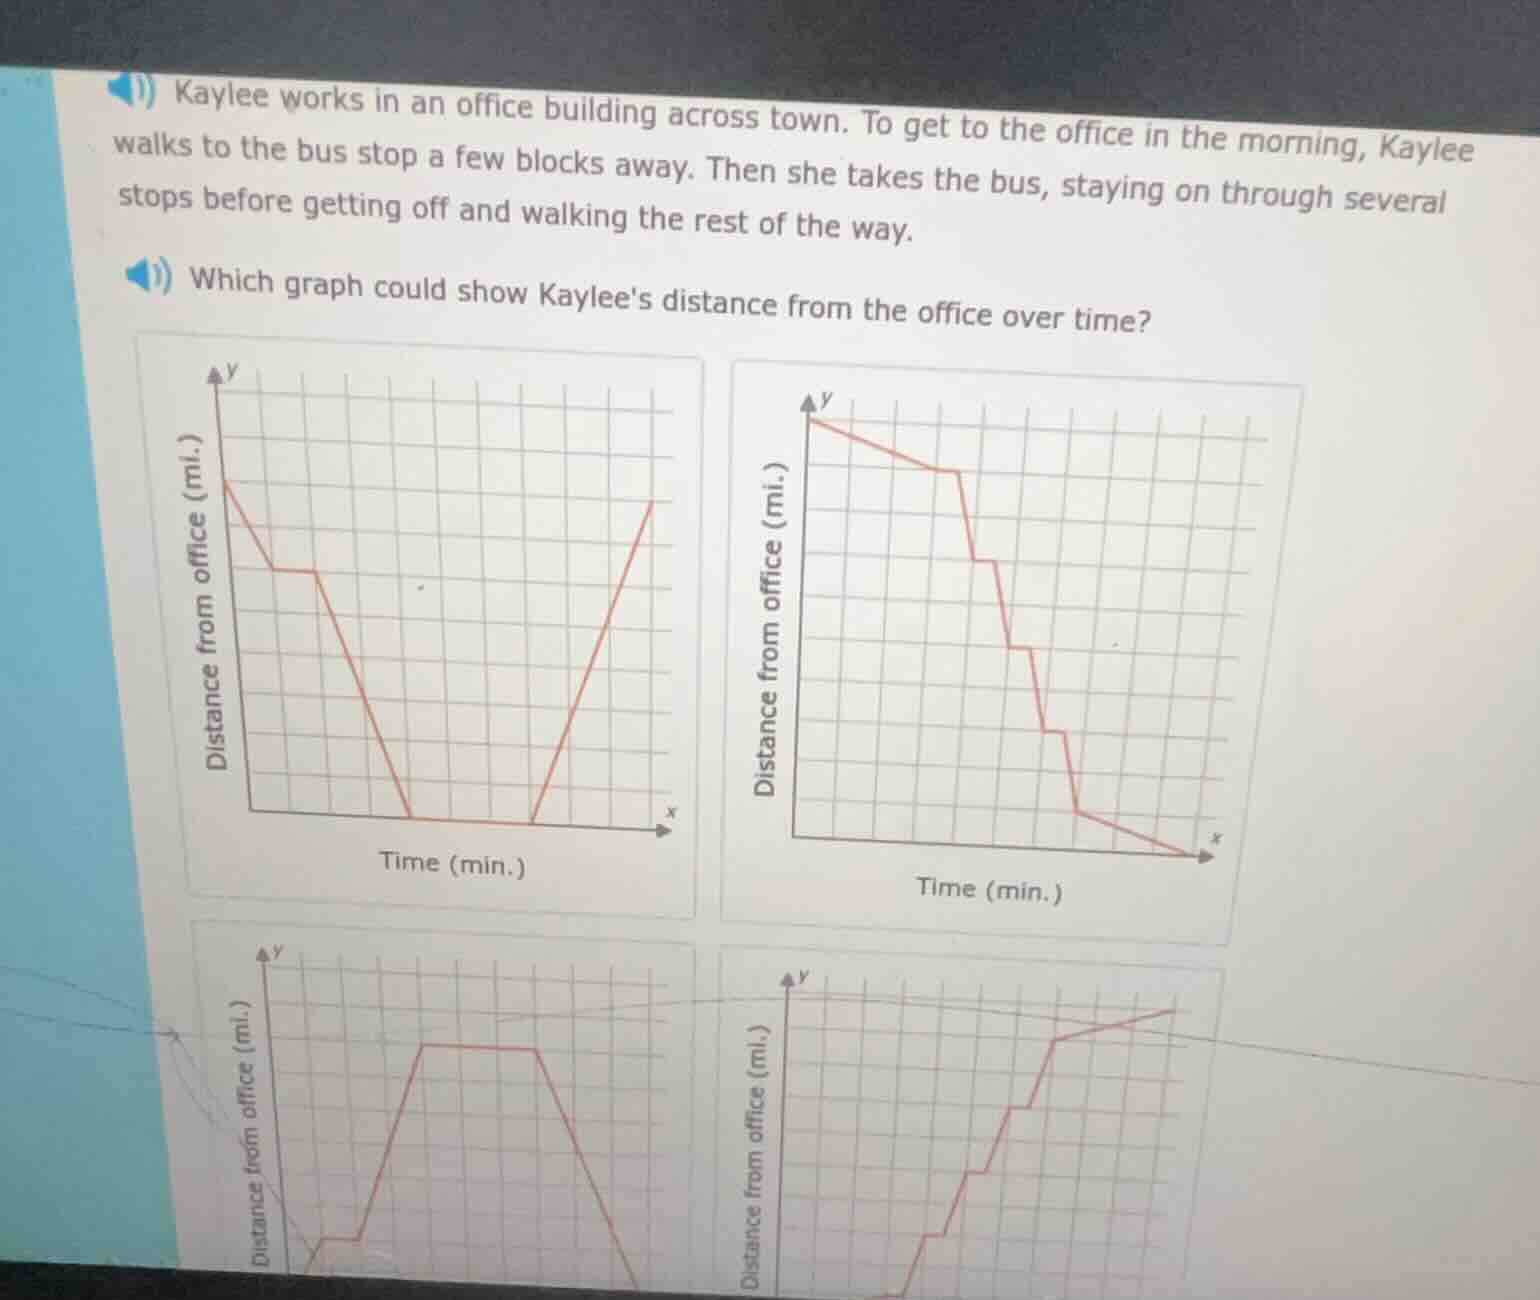
kaylee works in an office building across town. to get to the office in the morning, kaylee walks to the bus stop a few blocks away. then she takes the bus, staying on through several stops before getting off and walking the rest of the way. which graph could show kaylees distance from the office over time?
Step1: Analyze starting state
Kaylee starts at home, so initial distance from office is a positive value (y-axis starts above 0).
Step2: First movement (walk to bus)
Kaylee walks toward the office: distance decreases at a slow, constant rate (shallow downward slope).
Step3: Wait for/take bus start
When she reaches the bus stop, she may wait briefly, or the bus moves faster: first, a short flat segment (waiting) then a steeper downward slope (bus moves faster than walking, so distance decreases quicker).
Step4: Bus stops (multiple stops)
The bus stops at several stops; during each stop, distance from office stays constant (flat horizontal segments), then resumes steeper downward slope between stops.
Step5: Final walk to office
After getting off the bus, she walks the rest of the way: distance decreases at a slow, shallow downward slope until it reaches 0 (arrives at office).

Snap & solve any problem in the app
Get step-by-step solutions on Sovi AI
Photo-based solutions with guided steps
Explore more problems and detailed explanations
The top-right graph (with a starting positive y-value, shallow downward slope, steeper downward slope with multiple flat segments, and final shallow downward slope to 0) is the correct one.