QUESTION IMAGE
Question
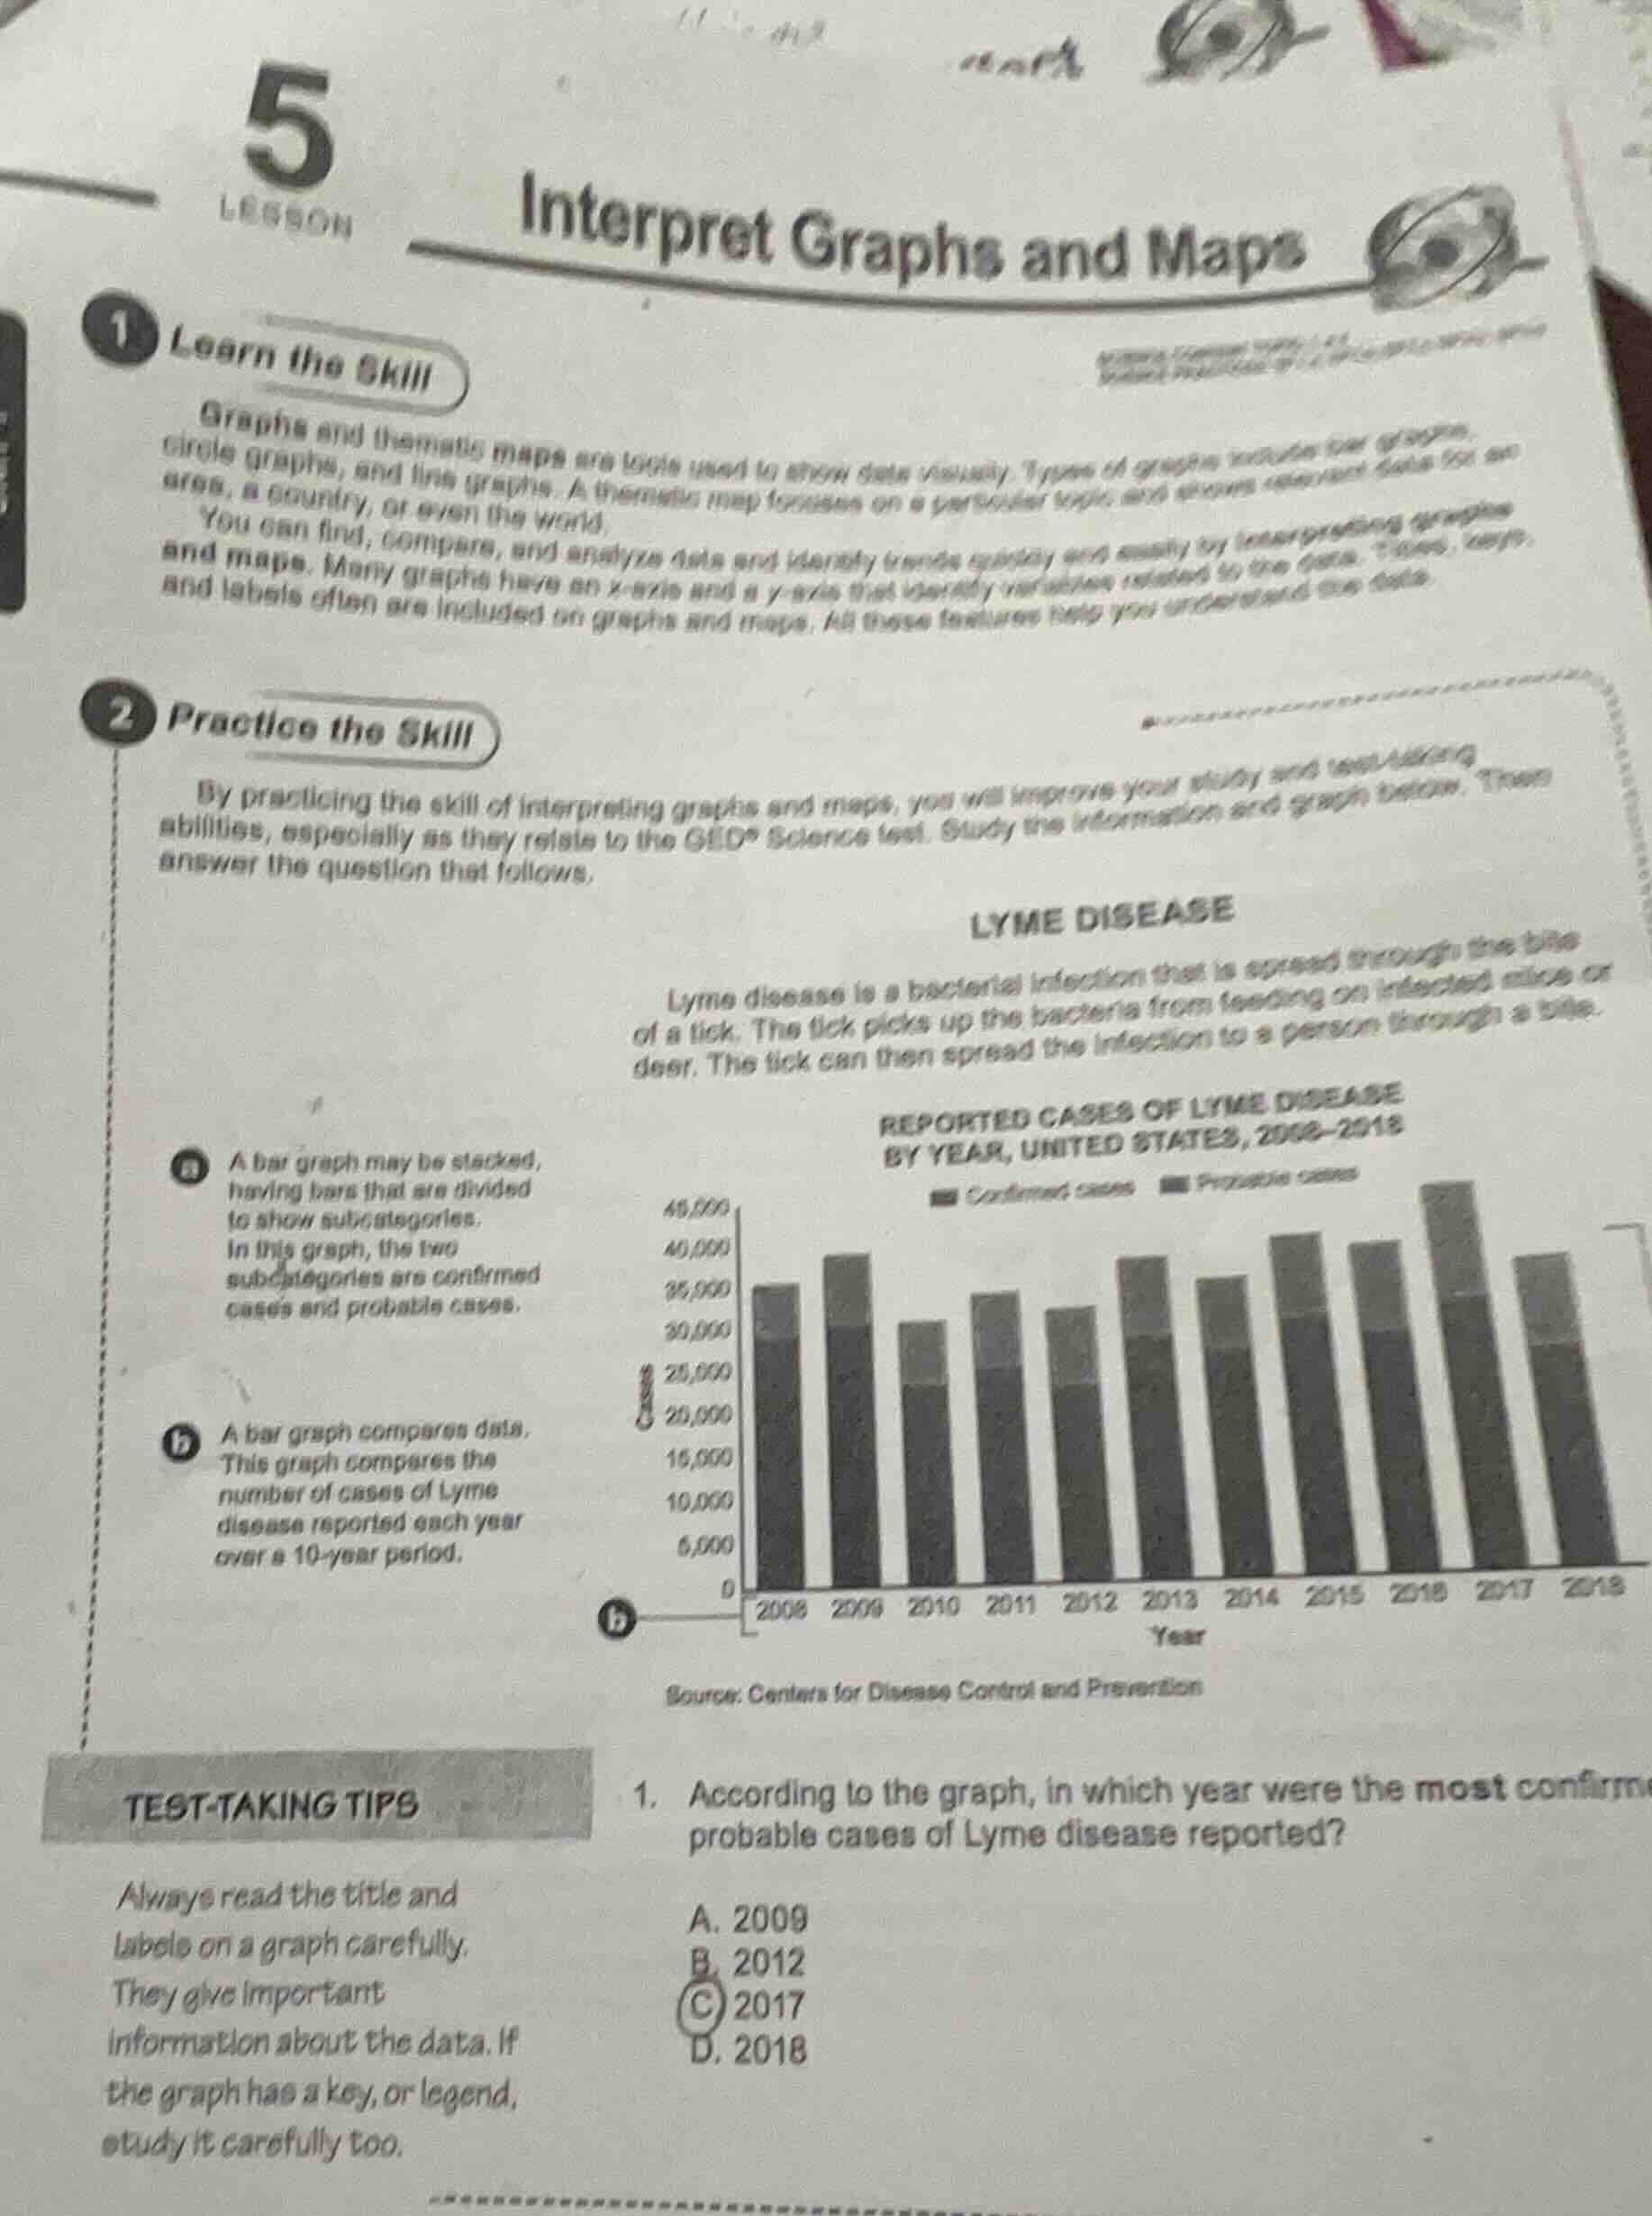
5 lesson interpret graphs and maps 1 learn the skill graphs and thematic maps are tools used to show data visually. types of graphs include bar graphs, circle graphs, and line graphs. a thematic map focuses on a particular topic and shows relevant data for an area, a country, or even the world. you can find, compare, and analyze data and identify trends quickly and easily by interpreting graphs and maps. many graphs have an x - axis and a y - axis that identify variables related to the data. titles, keys, and labels often are included on graphs and maps. all these features help you understand the data. 2 practice the skill by practicing the skill of interpreting graphs and maps, you will improve your study and test - taking abilities, especially as they relate to the ged® science test. study the information and graph below. then answer the question that follows. lyme disease lyme disease is a bacterial infection that is spread through the bite of a tick. the tick picks up the bacteria from feeding on infected mice or deer. the tick can then spread the infection to a person through a bite. a a bar graph may be stacked, having bars that are divided to show subcategories. in this graph, the two subcategories are confirmed cases and probable cases. b a bar graph compares data. this graph compares the number of cases of lyme disease reported each year over a 10 - year period. reported cases of lyme disease by year, united states, 2008 - 2018 (confirmed cases, probable cases) source: centers for disease control and prevention test - taking tips always read the title and labels on a graph carefully. they give important information about the data. if the graph has a key, or legend, study it carefully too. 1. according to the graph, in which year were the most confirm probable cases of lyme disease reported? a. 2009 b. 2012 c. 2017 d. 2018
To determine the year with the most confirmed and probable cases of Lyme disease, we analyze the stacked bar graph. The height of each bar (sum of confirmed and probable cases) is compared. The bar for 2017 is the tallest among the options, indicating the highest total cases.

Snap & solve any problem in the app
Get step-by-step solutions on Sovi AI
Photo-based solutions with guided steps
Explore more problems and detailed explanations
C. 2017