QUESTION IMAGE
Question
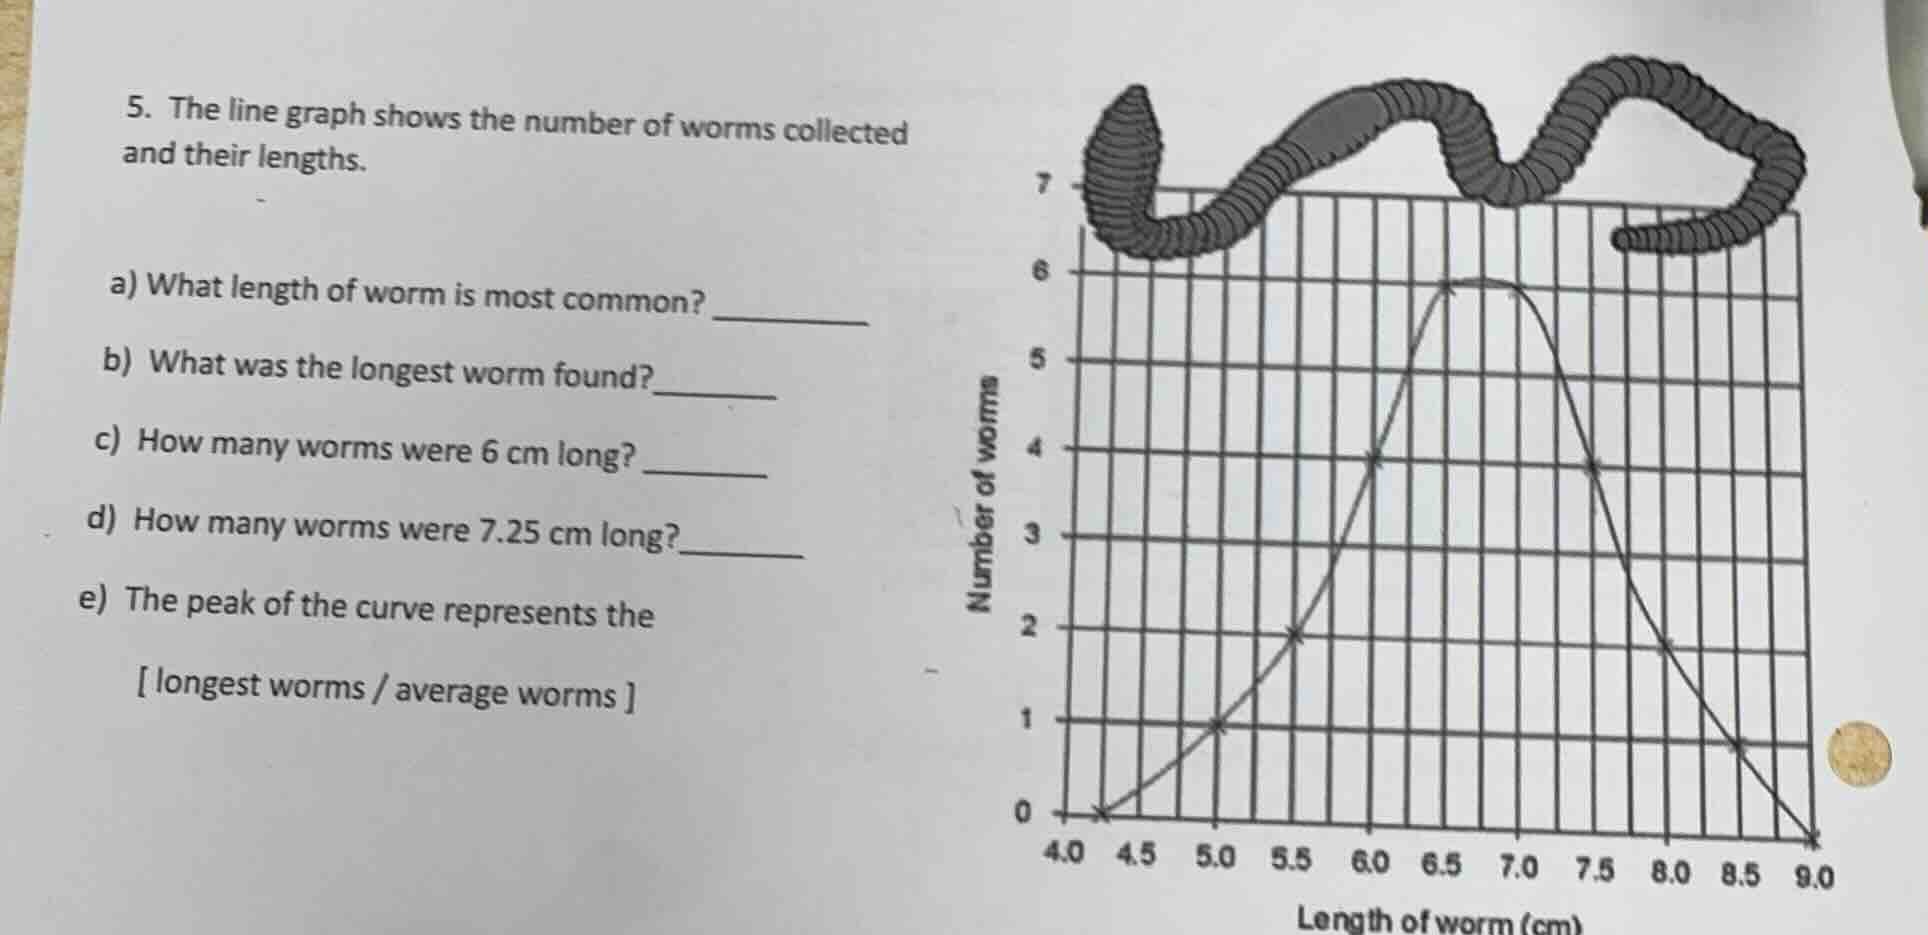
- the line graph shows the number of worms collected and their lengths.
a) what length of worm is most common? ______
b) what was the longest worm found?_____
c) how many worms were 6 cm long? _____
d) how many worms were 7.25 cm long?_____
e) the peak of the curve represents the
longest worms / average worms
Step1: Identify peak length
Look for the highest point on the graph; it aligns with 6.5 cm on the x-axis.
Step2: Find maximum x-axis value
The rightmost point on the x-axis is 9.0 cm.
Step3: Count worms at 6 cm
Locate 6 cm on x-axis, the corresponding y-value is 4.
Step4: Count worms at 7.25 cm
Locate 7.25 cm on x-axis, the corresponding y-value is 4.
Step5: Interpret curve peak
The peak shows the most frequent (average/modal) worm length.

Snap & solve any problem in the app
Get step-by-step solutions on Sovi AI
Photo-based solutions with guided steps
Explore more problems and detailed explanations
a) 6.5 cm
b) 9.0 cm
c) 4
d) 4
e) average worms