QUESTION IMAGE
Question
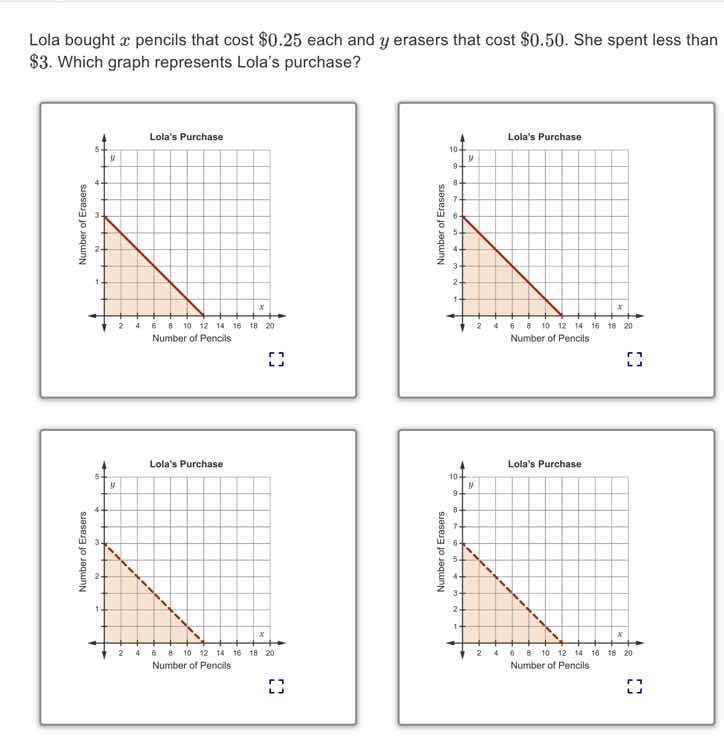
lola bought ( x ) pencils that cost $0.25 each and ( y ) erasers that cost $0.50. she spent less than $3. which graph represents lola’s purchase?
Step1: Formulate the inequality
The total cost of pencils is \(0.25x\) and the total cost of erasers is \(0.50y\). She spent less than \$3, so the inequality is \(0.25x + 0.50y < 3\).
Step2: Find the intercepts
To find the \(x\)-intercept, set \(y = 0\):
\[
\]
But for the boundary line (treating the inequality as an equation \(0.25x + 0.50y = 3\)), when \(y = 0\), \(x = 12\).
To find the \(y\)-intercept, set \(x = 0\):
\[
\]
Wait, no, wait. Wait, if we use the equation \(0.25x + 0.50y = 3\), when \(x = 0\), \(0.50y = 3\) so \(y = 6\)? But that contradicts the first graph. Wait, no, maybe I made a mistake. Wait, the cost of each pencil is \$0.25, so �LXI4� pencils cost �LXI5� dollars. Each eraser is \$0.50, so \(y\) erasers cost \(0.50y\) dollars. Total cost is \(0.25x + 0.50y\), which is less than \$3. So the inequality is \(0.25x + 0.50y < 3\).
Let's re - calculate the \(y\)-intercept. When \(x = 0\), \(0.50y=3\), so \(y = 6\). When \(y = 0\), \(0.25x = 3\), so \(x = 12\). Now, the inequality is strict (\(<\)), so the boundary line should be dashed. Also, we need to check the region. Let's take the origin \((0,0)\): \(0.25(0)+0.50(0)=0 < 3\), which satisfies the inequality, so the region containing the origin is the solution.
Now, let's analyze the graphs:
- The first graph: The \(y\)-intercept of the boundary line is 3, which is wrong because when \(x = 0\), \(y\) should be 6. So the first graph is incorrect.
- The second graph: The boundary line is solid, but our inequality is strict (\(<\)), so the line should be dashed. So the second graph is incorrect.
- The third graph: The \(y\)-intercept is 3, which is wrong.
- The fourth graph: The boundary line is dashed (because of the strict inequality), the \(x\)-intercept is 12, the \(y\)-intercept is 6, and the region containing the origin (since \(0 + 0<3\)) is shaded. So this graph is correct.
Wait, wait, I think I made a mistake earlier. Wait, no, wait the first graph: when \(x = 0\), \(y\) - intercept. Wait, maybe the cost of the erasers is \$0.50? Wait, no, if the first graph has a �LXI2�-intercept of 3, that would mean when �LXI3�, �LXI4� would give �LXI5�, but the first graph has �LXI6�-intercept 3. Wait, maybe I misread the cost. Wait, the problem says "x pencils that cost \$0.25 each and y erasers that cost \$0.50". Wait, no, maybe the cost of erasers is \$0.50? Wait, no, let's re - express the inequality.
\(0.25x+0.50y < 3\)
Multiply both sides by 4 to eliminate decimals: \(x + 2y < 12\)
Now, find the intercepts for the line \(x + 2y=12\):
When \(y = 0\), \(x = 12\)
When \(x = 0\), \(2y=12\), so \(y = 6\)
Ah! So the boundary line is \(x + 2y = 12\), with \(x\)-intercept 12 and \(y\)-intercept 6. Since the inequality is strict (\(<\)), the boundary line is dashed. Now, let's check the four graphs:
- First graph: \(y\)-intercept is 3 (not 6), so incorrect.
- Second graph: boundary line is solid (should be dashed), incorrect.
- Third graph: \(y\)-intercept is 3 (not 6), incorrect.
- Fourth graph: \(x\)-intercept 12, \(y\)-intercept 6, boundary line dashed, and the region containing the origin (which satisfies \(x + 2y<12\) as \(0 + 0<12\)) is shaded. So this is the correct graph.

Snap & solve any problem in the app
Get step-by-step solutions on Sovi AI
Photo-based solutions with guided steps
Explore more problems and detailed explanations
The fourth graph (with dashed line, x - intercept 12, y - intercept 6, and the region below the line including the origin shaded)